Vision
NAS and SAN in Virtualized Environments
Traditional enterprise storage was originally designed for two different use cases:
- Storing user files (Network Attached Storage or “NAS”)
- Providing fast, reliable disk storage directly to applications (Storage Area Network or “SAN”)
Twenty years ago, before virtualization, NAS was used to hold user files, public folders, archives, etc. SAN was used for databases, ERP, and other applications that either needed larger storage or higher reliability than disks attached directly to a server (direct-attached storage or “DAS”).
These systems were in wide use when VMware and other virtualization solutions started appearing on the market. Initially, VMware was used to virtualize single servers and used DAS. The physical server was a single point of failure for the virtual machines (VMs), and because there was no portability of VMs between single servers, you had to follow the same rules of physical server sizing: size the server for the biggest (peak) load. Most of the time this mean running underutilized servers, but there would be headroom for the peak load when needed. Think of retail, for example: a server needs to be sized for the holiday peak, even if in July the server is woefully underutilized. In the first wave of virtualization, that did not change.
The insight that made VMware an enterprise powerhouse was that if a running VM could be moved from one server to another within a resource pool, server resources could be optimized and utilization maximized. Networks were 100Mbps and sometimes 1Gbps, which is enough to live-migrate a VM’s CPU and memory. What was needed was a shared storage infrastructure that multiple servers could access simultaneously. VMware decided to support NAS and SAN: NAS with NFS, and SAN using iSCSI or Fibre Channel (FC) with their own proprietary file system, VMFS, placed on top.
The advantage was that most enterprises already had SAN, NAS or both, so they could immediately start using VMware on their existing storage. SAN and NAS were already reliable, had certified staff, and were well understood.
So VMware took off, and so did the use of NAS and SAN storage with virtualization. As virtualization was still at small scale, this worked well. But as virtualization began to reach higher and higher percentages of the overall storage workloads, problems became evident. In fact, VMware has reported that up to 40% of their trouble tickets are storage related.
Here are the problems:
NFS and NAS:
- Designed for thousands of users and millions or billions of files (virtualization use cases are more like hundreds of servers and thousands of VM files). It’s a different scale
- File server use-case is usually lock file, read into local memory, save back to the file server. VM use case is use the file as if it were a disk, reading and writing across the file.
- File servers files are many and small, and can be nested deep in folder trees (10MB is a very large file for file servers). The virtualization use case is the opposite: a relatively small number of very big files (10GB is a small VM), and a relatively shallow directory.
- File servers use a lot of metadata calls (e.g., lock, read attributes, set attributes, commit, lookup), to keep multiple users from accessing files, and maintain security with many users with different levels of access. The VM use case is almost all read/write.
- File servers typically read 100% when the file’s opened and write 100% when the file’s closed. VMs read/write constantly across the VM.
Most NAS is optimized for file server use case, so their design is not optimized for VMs, which can result in poor performance, overhead from unnecessary metadata calls, etc.
NAS, however, is file-centric, which maps well to the structure of VM objects (vDisks, config, metadata, memory, etc.)
SAN challenges include:
- Designed for 1 application to 1 LUN. The VM use case puts many VMs in a single LUN.
- Designed for transporting blocks quickly to disk, assuming all blocks are for the same application in a FIFO manner. In a VM environment, the SAN loses visibility into which blocks are with which VM, which can result in collisions and contention.
- Storage services at a LUN level (snap, replication, clone, etc.) make sense with a “one app: one LUN” paradigm.
SAN benefits include: raw speed, designed for random read/write across the LUN, which is similar to how vDisks are accessed.
The State of Storage and the Rise of Tintri
Tintri began with the goal of solving the most challenging problem facing virtualization at the time, which was storage. Traditional storage was not designed to handle the dynamic needs of virtualization. Storage was costly from both a CAPEX and OPEX point of view, diminishing the cost benefits of virtualization. It was also a major source of performance issues which caused virtualization projects to fail.
The idea of the Tintri VMstore was about storage designed specifically for enterprise, virtualized environments. Back in 2008, flash storage was still expensive compared to spinning disks, so Tintri started out building hybrid flash/disk arrays. As SSD costs decreased over time, all-flash VMstore arrays (AFAs) were added to the product line.
The file system was built specifically for storing VMs. More specifically, the storage had the intelligence to determine exactly what was going on for every VM. The file system knows which VM and virtual disk each IO belongs to, the latency of each IO, and the working set size of the workload on each virtual disk at any point in time. This allows the file system to provide performance isolation & Quality of Service (QoS), visibility/stats, data management (snapshots, clones) and automation at the VM level.
On top of these building blocks, Tintri built solutions for data protection and disaster recovery (DR). These include scheduled VM-granular snapshots and replication, VMware Site Recovery Manager (SRM) integration, time-travel VM restores (SyncVM), and file-level restore.
Virtualization deployments vary in scale from less than a hundred VMs to tens of thousands of VMs or more. It was clear that Tintri not only had to solve the data storage problem, but it also needed to tackle the challenge of managing VMs and storage at scale, from a few VMstores to hundreds of VMstores (in large test-dev environments, for example).
As traditional virtualization matured, enterprises started evolving from virtualization to private cloud to increase their agility and speed of deployment. Private cloud is built upon composable, software-driven services. With Tintri’s storage being API-driven from the start, and workflow automation-focused, its VMstore architecture was already synergistic with this growing trend, and the ecosystem integrations and supported use cases were expanded. For example, leveraging its APIs, QoS and protection policies can be configured on its storage platform at the VM granularity.
Having built a wealth of statistics about each virtual machine, Tintri saw the opportunity to use this information to solve the challenging problem of purchase planning and sizing for the dynamic workload, and unpredictable demands of private cloud. With solving that problem in mind, the company built its Tintri Analytics solution.
A Data Management Platform for the Data Center
Purpose-built for VMs and focused specifically on the problems of VM storage, Tintri VMstore provides management at the same level as the rest of the virtual infrastructure.
Tintri incorporates advances in flash technology, file system architecture, and user interface design to make storage for virtual applications uncomplicated and efficient. Tintri VMstore is designed from the ground up by experts in both virtualization and storage.
Tintri VMstore is managed in terms of VMs and virtual disks, not LUNs or volumes. The Tintri OS is built from scratch to meet the demands of a VM environment, and to provide features relevant to VMs. It is designed to use flash efficiently and reliably, while leveraging key technologies like deduplication, compression and automatic data placement to deliver 99% of all IO operations from flash.
These innovations shift the focus from managing storage as a separately configured component to managing VMs as a standalone entity. This paradigm overcomes the performance, management, and cost obstacles that prevent virtualization of more of the computing infrastructure. Tintri’s sharp focus on creating a better storage system for VMs enables the creation of a fundamentally new type of product.
The way Tintri focuses on VMs is most apparent in the VMstore management interface, which presents VMs as the basic units of management, rather than LUNs, volumes, or files. Every object in the interface is familiar to VM administrators. The interface is straightforward enough for VM administrators to manage storage directly, yet sophisticated enough for storage administrators to leverage their expertise in managing storage for large numbers of VMs.
Building a VM-focused management interface involves far more than just a helpful and attractive graphical user interface (GUI), however. The underlying storage system natively understands and supports storage management operations such as performance and capacity monitoring, snapshots, quality of service (QoS) management, and replication at the VM level.
Focusing exclusively on VMs enables Tintri to eliminate the levels of mapping and complexity required by general-purpose storage systems. Decision-making is delegated to lower levels of the system, which allows higher levels of automation and optimization than is possible for general-purpose storage systems. The result is an agile architecture with much simpler abstractions and interfaces. This in turn facilitates further automation and optimization.
Tintri Design Goals
Interwoven throughout all Tintri products is the manifestation of these design goals. This list is not in any particular order, as the goals hold equal weight.
- Data Integrity
- Availability
- Simplicity
- Performance
- Scale
- Automation
- Analytics
- Self-Service
- VM/Application Awareness
Data Integrity
Purpose-built storage appliances serving enterprise workloads typically use commodity hardware with value-added OS and file system software. The components of these appliances — hardware and software — can and do fail from time to time. For example, the total failure of a controller in a dual-controller system is immediately user-visible, albeit without operational impact on serving data. Other failures, such as firmware errors, are subtle and can cause corruption that may only surface much later.
Tintri VMstore appliances are purpose-built to leverage cost-effective, multi-level cell (MLC) flash solid-state drives (SSD) and high-capacity SATA hard disk drives (HDD) using a proprietary VM-aware file system. The Tintri OS runs on VMstore appliances and has comprehensive data integrity and reliability features to guard against hardware and software component malfunctions. These data integrity features work in concert to provide optimal performance and system availability.
Data integrity is essential to storage, especially primary storage systems. A robust, multi-layered approach must be used to protect against all manner of hardware and firmware errors. Possible failures include:
- Complete failures, such as a controller failure or a drive failure.
- The many erroneous behaviors (short of complete failure) by individual components such as HDD and SSD. For example, drives can return corrupted data on read operations, fail to write data, etc.
- Data is constantly moved, even after it is written to stable storage. Data movements can potentially compromise data integrity. Examples of data movement include:
- SSD’s complex internal mechanisms such as garbage collection (GC), due to asymmetric read and write granularities.
- HDD’s remap due to bad sectors.
- File system GC as a result of deduplication and compression.
- Advanced functionality such as deduplication and compression can turn otherwise small errors into major issues. Many files reference the same block of data as a result of deduplication, and an error with one block can affect all related files.
A comprehensive data integrity strategy must cover these cases and more, not just simple component failures. Data integrity features must also work in concert to ensure end-to-end integrity.
Availability
Flash is often considered the second-most disruptive technology, after virtualization, in the datacenter. Flash offers IT architects a way around the storage bottleneck caused by virtualization’s extremely random IO needs, which could choke legacy disk-centric storage.
Using single-level cell (SLC) technology, the first wave of flash deployments in the data center was targeted at customers who needed performance at any cost. In this wave, flash was as much as 20 times the cost of disks, and was mostly used as the end-point for data in SANs or direct-attached storage. Even with flash used as a read cache, the high cost and configuration restrictions severely limited adoption for virtualization and mainstream application.
To bring down costs, the second wave of flash deployment leveraged multi-level cell (MLC) flash technology. MLC flash is cheaper, but has a fraction of the endurance of SLC flash. To make MLC and enterprise MLC (eMLC) flash reliable enough as a data endpoint, vendors coupled it with clever algorithms such as wear leveling, and in some cases dual-parity RAID. But the random nature of IO from virtualization, wear leveling and RAID algorithms, along with the unique way data is written on flash, caused issues around write amplification. Storage designed with either SLC or MLC flash can suffer from write amplification, where the amount of data written to flash is a multiple of the actual data that needs to be written; the impact is more pronounced in MLC flash.
Many flash-only and hybrid flash-disk vendors tried to solve write amplification problems using a flash file system incorporating GC, which involves reading and rewriting data to flash memory. Poorly implemented GC algorithms can cause latency spikes and limit the effective utilization of flash capacity, even when flash is being used as a cache.
On the cost front, in virtual environments even with data reduction techniques such as compression and deduplication, eMLC and MLC-based flash-only storage is substantially more expensive than equivalent disks and hybrid flash-disk storage. Due to advances in density and capacity, hard disk drives have been able to maintain a substantial cost lead over flash.
Tintri’s FlashFirst design uses a variety of techniques to handle write amplification, ensure longevity and safeguard against failures:
- Data reduction using deduplication and compression. This reduces data before it is stored in flash, resulting in fewer writes.
- Intelligent wear leveling and GC algorithms. This leverages not only information on flash devices, but also real-time active data from individual VMs for longer life and consistently low latency.
- SMART (Self-Monitoring, Analysis and Reporting Technology). This monitors flash devices for any potential problem, issuing alerts before they escalate.
- High-performance, dual-parity RAID 6. This delivers higher availability than RAID-10 without the inefficiency of mirroring, or the performance hit of traditional RAID 6 implementations.
Tintri VMstore was designed for enterprise-class availability. Starting with storage, VMstore uses dual-parity RAID 6, real-time correction and continuous verification. This ensures data integrity and delivers higher availability than RAID-10 without the inefficiences.
On the hardware front, in addition to using redundant components and connectivity, VMstore uses a dual controller active/standby setup. Each of these controllers can be independently upgraded in a rolling fashion, ensuring VMs supported by the VMstore are always up and running during controller updates.
VMstore also delivers proactive support with phone-home monitoring and reporting. Administrators get automated notifications and alerts related to areas such as capacity/planning, network connectivity, and predictive disk health, allowing them to get ahead of any issues. Administrators can also trigger creation of a support bundle on-demand. This will perform a diagnostic check of the system for additional peace of mind.
IT infrastructure can be simplified through VM awareness. Tintri provides VM-aware storage that frees IT from having to worry about and orchestrate the complexities of LUNs, zoning, masking, and other storage specifics. Because all Tintri capabilities are provided at VM granularity, Tintri VMstore storage arrays add significant value in terms of allowing users to easily protect and replicate individual VMs.
Performance
The first VMstore appliances used a combination of flash-based solid-state devices (SSDs) and high-capacity disk drives for storage. Tintri’s patented FlashFirst design incorporates algorithms for inline deduplication, compression and working set analysis to service more than 99% of all IO from flash for very high levels of throughput, and consistent sub-millisecond latencies for both read and write operations.
Flash-first design minimizes swapping between SSD and HDD by leveraging data reduction in the form of deduplication and compression, increasing the amount of data that can be stored on flash. Only cold data is evicted to disk, which does not impact application performance. It takes advantage of the fact that each VM has an active working set, which is a fraction of the overall VM.
Traditional storage systems often incorporate flash to an existing disk-based architecture, using it as a cache or bolt-on tier, while continuing to use disk IO as part of the basic data path. In comparison, VMstore services 99% of IO requests directly from flash, achieving dramatically lower flash-level latencies, while delivering the cost advantages of disk storage.
Newer VMstore appliances can also be procured in an all-flash configuration. The FlashFirst design is still critically important, because the all-flash appliance contains different flash tiers. The same IO handling that enabled the efficient use of the SSD and HDD also allows the efficient use of faster, more expensive SSDs for performance and slower, cheaper SSDs for capacity.
Optimized for Performance
Tintri VMstore is engineered to deliver the highest possible application performance in an intelligent and cost-effective manner. Two examples of this are per-VM storage QoS and VM Auto-Alignment. Let’s take a look at these two a little more in-depth.
Per-VM Storage QoS
Typically, storage appliances are unaware of VMs, but Tintri is an exception. Because of Tintri’s tight integration with hypervisor environments like VMware, Hyper-V, etc., the Tintri file system has information about the VMs residing on it. With this VM information, the file system can distinguish between IOs generated by two different VMs. This forms the basis for providing per-VM Storage Quality of Service (QoS) in the file system.
QoS is critical when storage must support high-performance databases generating plenty of IO alongside latency-sensitive virtual desktops. This is commonly referred to as the noisy neighbor problem in legacy storage architectures that are flash-only and lack VM-granular QoS. Tintri VMstore ensures database IO does not starve the virtual desktops, making it possible to have thousands of VMs served from the same storage system.
Tintri VMstore’s QoS capability is complementary to VMware’s performance management capability. The result is consistent performance where needed. And all of the VM QoS functionality is transparent, so there is no need to manually tune the array or perform any administrative touch.
VM Auto-Alignment
VM alignment is another tricky issue that poses real challenges as virtualization deployment expands across enterprise data centers. Misaligned VMs magnify IO requests, consuming extra IOPS on the storage array. The impact snowballs as the environment grows, with a single array supporting hundreds of VMs. At this size, performance impact estimates range from 10% to more than 30%.
Every VM writes data to disk in logical chunks. Storage arrays also represent data in logical blocks. When a VM is created, the block boundaries of the VM and storage do not always align automatically. If the blocks are not aligned, VM requests span two storage blocks, requiring an additional IO operation.
Storage administrators in virtualized data centers attempt to address this issue by aligning VMs to reduce the impact of misalignment on performance. Unfortunately, realigning a VM is a manual, iterative process that generally requires downtime.
VMstore offers VM auto-alignment. Rather than the disruptive approach of realigning each VM, Tintri VMstore dynamically adapts to the VM layout. Tintri VMstore automatically aligns all VMs as they are created, migrated or cloned — with zero downtime. An IT administrator can now eliminate this arcane task and enjoy performance gains with no VM downtime, and zero administrator intervention.
Scale
Modern enterprises are facing growing data storage requirements. In part, this situation is due to an increased reliance on digital processing and communication tools, and greater data retention for business intelligence projects. However, accurately predicting how much data storage capacity each unique organization will need in five years, let alone in one, is incredibly difficult, and the ability to scale capacity is constrained by factors such as available space, power, and cooling.
Another capacity consideration is that storage technology is advancing very quickly. The brick-sized hard disk storage devices of the 1980s, holding the data equivalent of a single encyclopedia, have been replaced by devices an eighth of that size that are able to store the text from every book ever written.
Server virtualization helped to solve one of the major challenges of scaling applications by getting more usage out of available computing power. To solve scaling challenges with traditional storage, however, the storage industry is starting to embrace scale-out techniques which can also benefit from application-aware storage.
A scale-out architecture assumes that you want to grow capacity over time, and that each additional upgrade will be add both storage capacity and performance capability. Scale-out uses a type of building-brick methodology that adds each appliance into a seamless namespace, so that the underlying virtual servers and applications can access more capacity but without requiring reconfigurations.
The addition of application awareness to this scale-out architecture enables the upgrade process to be more granular. This is because application awareness gives an organization better insight into the underlying workloads and demands of applications compared to their ability to deliver against the requirements offered by the storage system. An admin might therefore configure the type of storage appliances added to storage pools for more flash, or for slower, but cheaper, hard disks for workloads where performance isn’t needed. The scale-out may favor appliances with more connectivity to the network, to reduce issues like latency, or to support more concurrent users. This mix-and-match approach enables organizations to tailor their requirements and budgets with more finesse.
Automation
Many enterprise IT teams are deploying private clouds to allow on-premises infrastructure to offer the streamlined consumption model, improved agility, and economics of the public cloud. Enterprises need to simplify and automate services available from existing IT infrastructure to achieve this goal.
All Tintri functions are presented via an external RESTful API. You don’t need to focus on disk; you can think purely about what you want to achieve:
- Offer Tintri snapshots on demand
- Offer VM replication on demand
- Sync data between two machines for a DevOps team
With the Tintri REST API, any automation tool can invoke Tintri-specific functions.
Integration is important, too. For example, VMware vRealize Automation has become a popular cloud platform supporting self-service for private and hybrid cloud deployments. VMware vRealize Orchestrator simplifies the process of creating fully custom workflows. Tintri vRealize Orchestrator plugin facilitates the integration and use of Tintri storage in vRealize environments. It provides a variety of pre-defined workflows for common Tintri tasks.
Simplicity of Management and User Experience
The complexities associated with managing NAS and SAN storage systems were introduced into a construct that was supposed to consolidate and simplify management of server infrastructure; instead, the opposite happened.
One of the core tenants of VMware upon its introduction to the mainstream was the simplification of infrastructure management, most notably surrounding centralizing the management of servers. But when it made the decision to support NFS, FC, and iSCSI, it created a need for every server admin to become a storage expert.
This also shifted responsibilities, seemingly overnight, in the datacenter. All of a sudden, the storage teams and server teams couldn’t operate independently anymore. They had to communicate changes effectively, as the entire server infrastructure now lived (in many cases) upon a single storage system, as mass consolidation took hold.
Tintri recognized this need, and set out to build a box that required no upfront configuration, removing all-things “storage” with pre-configured and immutable standards, allowing IT server admins and “generalists” the ability to manage their own storage specific to their virtual environment, and removing the communication gap between server and storage teams.
Over time, support for additional hypervisors has been added. The current supported list:
- VMware vSphere
- Microsoft Hyper-V
- Citrix XenServer
- Red Hat Enterprise Virtualization (RHEV)
- OpenStack
One or many hypervisors from this list are supported and can be managed from a single interface within Tintri without requiring a splitting of the array into dedicated capacity for each hypervisor. All VMs from each hypervisor live within the same Tintri file system, which presents itself as NFS to most hypervisors and SMB3 for Hyper-V.
This approach builds upon a standard of simplicity and allows the addition of more hypervisors and additional storage abstractions within the same file system. Additional protocols can be added on top to communicate between the file system and other hypervisors.
An example of this potential is Tintri’s support for containers, which is another abstraction sitting on the file system. In the future, support for Persistent Volumes will be added. This is the storage needed by containers to remain intact as they are turned on and off, and created and destroyed.
This provides the ability to support any container ecosystem, including bare metal, where the ephemeral storage such as OS and applications is held on local storage within the container itself, and application data is held within the persistent volume for future containers to use. For now, Tintri uses iSCSI as the protocol of choice, but this is just another protocol like NFS or SMB3 that communicates with the file system.
In addition, extensibility affords Tintri admins a native experience using plugins within VMware vCenter via the Web Client plugin, and Microsoft Hyper-V using the SCVMM plugin.
Tintri VMstore is designed from the ground up for virtualized environments and the cloud. Global enterprises have deployed hundreds of thousands of VMs on Tintri storage systems; they run Microsoft SQL Server, Exchange, SharePoint, SAP, virtual desktop infrastructure (VDI) workloads, and business-critical applications such as Active Directory and private cloud deployments.
VMware vSphere
Deploying storage into a virtual environment should be a straightforward process. Tintri VMstore is designed so that IT administrators with a working knowledge of vSphere can successfully deploy Tintri’s purpose-built VM storage as easily as ESX/ESXi Server.
Tintri VMstore’s approach automatically ensures every VM gets the performance it needs. Expanding storage is simple, as each VMstore appliance appears as an additional, high-capacity datastore in VMware vCenter. This makes it easy to scale and manage each node as part of a VMware Storage DRS cluster, and eliminates any risk of downtime.
Tintri VMstore also delivers extreme performance and VM density, and a wide variety of powerful features, which are seamlessly integrated with vSphere. Examples include snapshots, clones, instant bottleneck visualization, and automatic virtual disk alignment. Tintri VMstore extends and simplifies the management of VMs through an intrinsic VM awareness that reaches from the top of the computing stack all the way down into the flash (SSD) and disk (HDD) drives.
Hyper-V
With native Microsoft Server Message Block (SMB) 3.0 implementation, Tintri VMstore is also optimized for Hyper-V, providing superior performance and reliability. The purpose-built SMB 3.0 stack on Tintri VMstore supports key functionalities, including Transparent Failover and High Availability (HA), for running enterprise workloads.
Through native integration with Microsoft System Center Virtual Machine Manager (SCVMM) and Hyper- V, Tintri offers VM-level visibility and control, offering millions of Microsoft customers a dramatically simplified experience to virtualize business-critical Microsoft enterprise applications and desktops. It also accelerates private cloud deployments.
Support for SMB 3.0 functionality, such as Offloaded Data Transfers (ODX), creates efficient resource utilization, allowing users to experience the efficiency of Tintri per-VM cloning technology directly from SCVMM.
Tintri Makes Storage for Generalists
Tintri VMstore storage arrays are purpose-built for virtualization and the cloud. IT administrators with working knowledge of virtualization can easily deploy Tintri storage without specialized storage knowledge. When deploying Tintri storage, there are no prerequisite operations such as LUN provisioning, HBA compatibility checks, or FC LUN zoning operations. From a VMware administrator’s point of view, the entire Tintri VMstore is presented as a single datastore.
Virtualization and consolidation onto shared infrastructure has its challenges. In addition to performance issues and management complexity, virtualizing multiple workloads makes it harder for admins to identify bottlenecks, understand the impact of new workloads, and troubleshoot problems such as misconfiguration of VMs and shared infrastructure, including storage.
Traditional storage architectures make these issues cumbersome for administrators to troubleshoot. They can provide a performance view from the LUN, volume or file system standpoint. But that architecture cannot isolate VM performance or provide insight into VM-level performance characteristics. It’s difficult for administrators to understand situations such as the impact of a new VM workload without access to relevant VM performance metrics.
Identifying the cause of performance bottlenecks is a time-consuming, frustrating and sometimes inconclusive process that requires iteratively gathering data, analyzing the data to form a hypothesis, then testing the hypothesis. In large enterprises, this process often involves coordination between several individuals or departments, typically spanning many days or even weeks.
To gain deep insight into virtualization environments using traditional storage architectures requires IT to deploy separate, complex software solutions. Even then, IT can spend days troubleshooting performance issues due to complexity and lack of skills. This can cause IT to steer clear of mixing workloads on the same storage, resulting in silos of virtualization.
In rare cases, administrators may even resort to allocating a single LUN or volume for a single VM. Unfortunately, this is not practical with traditional storage architectures due to scaling limitations and management overhead. Over time, the LUN sprawl from a method like this can also become overwhelming to manage.
Tintri VMstore provides a complete, comprehensive view of VMs, including end-to-end tracking and visualization of performance across the entire data center infrastructure. This ensures administrators can easily procure the critical statistics they need for individual VMs.
By monitoring IO requests at the vDisk and VM level and integrating with vCenter APIs, Tintri VMstore identifies the corresponding VM for each individual IO request and can determine if latency occurs at the hypervisor, network, or storage levels. For each VM and vDisk stored on the system, administrators can use Tintri VMstore to instantly visualize where potential performance issues may exist across the stack. Latency statistics are displayed in an intuitive and clear format so that administrators can immediately see the bottleneck, rather than trying to deduce the location from indirect measurements and time-consuming detective work.
Administrators can also detect data trends from VMstore and individual VMs, without the added complexity of installing and maintaining separate software. This built-in insight can reduce costs and simplify planning activities, especially around virtualizing IO-intensive critical applications and end-user desktops.
To handle monitoring and reporting across multiple VMstore systems, Tintri created Tintri Global Center. Built on a solid architectural foundation capable of supporting more than one million VMs, Tintri Global Center is an intuitive, centralized control platform that lets administrators monitor and administer multiple geographically distributed VMstore systems from a single interface. IT administrators can view and create summary reports across all or a subset of VMstore systems with in-depth information on storage performance (IOPS, latency, throughput), capacity, vCenter clusters, host status, protection status, and more.
In addition to summary information presented at a glance, Tintri Global Center also provides the ability to filter and display metrics for individual VMstore systems and specific VMs, allowing for easy troubleshooting. Tintri Global Center is designed to enable a rich ecosystem built around REST APIs. In future versions, the APIs will be available for Tintri partners and customers to develop custom solutions combining various VM-granular tasks, such as performance monitoring across multiple VMstore systems and their VMs.
Focus on What’s Most Important
The cloud model has had a profound effect on the enterprise IT landscape. Organizations are creating private cloud infrastructures to deliver a similar user experience as the public cloud, delivering the benefits of greater business agility and lower IT costs.
Many enterprises are combining both private cloud and public cloud resources in a hybrid cloud model that allows them to take advantage of the predictable performance and costs of on-premises infrastructure, while utilizing the public cloud for special projects, bursts of activity that exceed on-premises capacity, and other special needs.
Creating a private cloud requires some fundamental changes to IT:
- Simplify the underlying infrastructure
- Develop a simple methodology to provide IT-as-a-Service
- Improve quality via repeatable, standardized deployments that reduce human error
- Improve speed of service delivery via automation
- Adapt and change with evolving business needs
Because Tintri VMstore systems let you focus at the VM level, making these fundamental changes is much simpler. For example, when automating storage policies for a VM, the operations are executed natively on the storage system. The operational overhead of these tasks is minimal, as is the effort required to automate them. Speed of delivery and standardization increase as a result.
Also, thanks to the scale-out storage architecture, you don’t need to buy more storage (or see more capital expenditure) than you initially need. Instead, as your capacity or performance requirements grow, you can buy additional, simple-to-add appliances to scale both capacity and performance on demand. By scaling out at an appropriate pace instead of buying everything up front, the private cloud can adapt and change with evolving business needs.
Virtualization Awareness
Tintri Storage is Virtualization Aware
Simply put, this is the inherent ability of a storage system to understand which data corresponds to which VM. Leading virtualization software platforms VMware vSphere and Microsoft Hyper-V support NAS protocols: NFSv3 and SMB, respectively. When operating with NAS-based storage, a VM’s virtual disks correspond to individual files on the NAS server. Most VMs are made up of a small number of metadata files, and a small number of large files corresponding to virtual disk images.
Leveraging APIs presented by the virtualization software, such as VMware vCenter Server, the storage can interrogate the virtualization infrastructure to learn the mapping of VMs to files. When processing a given IO operation associated with a given virtual disk file, the storage system can map the file back to the actual VM it belongs to and apply appropriate VM-specific policies. In addition, due to the fact that any given IO in a NAS environment must always identify which file is being operated upon, the storage system also knows which VM is being operated upon.
Thus, every sort of VM-specific policy can be applied, such as:
- QoS to the processing of individual IOs
- Space reservations on a per-VM basis
- The ability to perform data management on the basis of small groupings of files
- That is, of course, if the storage system is designed with this granular functionality of VM management in mind (as in the case of Tintri VMstore)
A Modern Approach to Shared Storage
Purpose-built for VMs and focused specifically on the problems of VM storage, Tintri VMstore provides management at the same level as the rest of the virtual infrastructure.
Tintri VMstore is managed in terms of VMs and virtual disks, not LUNs or volumes. The Tintri OS is built from scratch to meet the demands of a VM environment, and to provide features relevant to VMs. It is designed to use flash efficiently and reliably while leveraging key technologies like deduplication, compression and automatic data placement to deliver 99% of IO from flash.
These innovations shift the focus from managing storage as a separately configured component to managing VMs as a whole. This overcomes the performance, management, and cost obstacles that prevent more of the computing infrastructure from being virtualized. Our sharp focus on creating a better storage system for VMs enables us to build a fundamentally new type of product.
Building a VM-focused management interface relies on far more than just an attractive GUI. The underlying storage system natively understands and supports storage management operations such as performance and capacity monitoring, snapshots, QoS management, and replication at the VM level.
Focusing exclusively on VMs enables Tintri to eliminate unnecessary levels of mapping and complexity required by general purpose storage systems. Decision-making is delegated to lower levels of the system and achieves much higher levels of automation and optimization than is possible for general-purpose storage systems. The result is an agile architecture with much simpler abstractions and interfaces, which in turn facilitates further automation and optimization.
The way Tintri focuses on VMs is most apparent in the VMstore management interface, which presents VMs as the basic units of management, rather than LUNs, volumes, or files. Every object in the interface is familiar to VM administrators. The interface is straightforward enough for VM administrators to manage storage directly, yet sophisticated enough for storage administrators to leverage their expertise in managing storage for large numbers of VMs. Titntri VMstore stores and analyzes virtual machine files in a way that can best be describe as “VM Awareness.”
Block vs. File
Legacy block storage vendors often argue that block storage protocols are somehow more efficient than file storage protocols, but that’s wrong. If this was indeed ever the case, it has certainly not been the case for the last decade, or perhaps even longer. VMware’s own data demonstrates that ESXi’s performance doesn’t suffer in any way using file storage protocols vs. block protocols. In other words, there is no benefit to using a block protocol for hosting VMs.
Simplifying network configurations and providing the ability to map per-VM operations directly to the files within underlying storage systems makes it clear that file-based protocols are a good match for virtualization storage, enabling VM-aware storage.
Per-VM Visibility
Troubleshooting storage performance problems in a virtual environment can be dreadful. Complaints about a slow VM can often be attributed to storage, but how do you verify this when the VM is sharing a LUN with a dozen other VMs, and that LUN is a slice of a RAID array that contains many other LUNs? The problem could also have its roots in the ESXi host or the storage network, or even the user’s application. The legacy array provides no statistics on a per-VM basis.
Identifying performance bottlenecks is a time-consuming, frustrating and often inconclusive process that requires gathering immense amounts of data, analyzing that data to form a hypothesis, and then testing. In larger enterprises, this process often involves coordination between several people and departments, and can span many days, weeks, and even months.
Tintri VMstore collects per-VM hypervisor latency stats and directly correlates them with per-VM storage stats. This provides a level of visualization that legacy vendors simply cannot match. The hypervisor latencies are obtained using standard VMware vCenter APIs, while the network, file system and disk latencies are provided by Tintri VMstore, which knows, for each IO request, the identity of the corresponding VM.
Granular stats are collected at all of the following levels:
- File level
- flat-vmdk
- swap
- config
- redo logs
- snapshots
- Virtual disks
- Virtual machine
- Target IP
- Target ethernet device
- Target system
Per-VM Performance Metrics
The troubleshooting process described above is fully automated using Tintri instant bottleneck visualization. For each VM and vDisk stored on the system, Tintri displays a breakdown of the end-to-end latency, from the guest OS down to the disks within the Tintri appliance.
For any VM or vDisk, you can see at-a-glance how much of the latency was spent in the ESXi host, the network, the Tintri file system, or accessing the disk. A history of this information is automatically stored and can be displayed as a graph, so you can see the bottleneck for each VM at any given point over the last seven days.
Tintri then provides these statistics in an intuitive format. In an instant you can see the bottleneck, rather than trying to deduce where it is based on indirect measurements and time-consuming detective work.
Per-VM Data Management
Snapshots
Legacy shared-storage architectures provide snapshots of storage objects, such as LUNs and volumes, rather than VMs. These snapshot technologies lead to inefficient storage utilization, as hundreds of VMs with varying change rates are often snapshotted at once. Snapshot schedules can only be set at a LUN or volume level, leading to such best practice recommendations as creating one LUN per VM as a workaround for the need to create individualized snapshot schedules at a per-VM level.
Unique space-efficient and granular per-VM snapshots allow administrators to create snapshots of individual VMs and quickly recover data or entire VMs from snapshots. Tintri OS supports 128 snapshots per VM for scalable data protection. Data protection management is also simplified with default snapshot schedules that protect every VM automatically, while custom schedules on a per-VM basis can be used to tailor data protection needs for specific VMs.
Note that a system-wide default snapshot schedule does not create interdependencies between each VM’s respective snapshots. Each VM still “owns” its own individual snapshots and the system-default schedule can be overridden on a per-VM basis. Applying VM-specific snapshot settings that differ from the system default schedule is straightforward and painless.
Tintri OS provides crash-consistent and hypervisor-coordinated, VM-consistent snapshots. Crash-consistent snapshots do not take extra measures with the hypervisor or guest VM to coordinate snapshots. Thanks to integration with native hypervisor management tools such as VMware vCenter integration, Tintri OS provides VM-consistent snapshots for simpler application recovery. With VM-consistent snapshots, hypervisor management APIs are invoked to quiesce the application in a VM, for a VM-consistent snapshot.
Clones
Tintri OS leverages per-VM snapshots to allow users to create new VMs through cloning operations. In cloning, the state captured in a given VM snapshot serves as the “parent,”and the new “cloned” VMs can be thought of as “children.” Like actual children, new VMs created via cloning operations exist and function independently from the parent VM(s) from which they are created. Behind the scenes, the new VMs share common vDisk references with their parent VM snapshots to maximize space and performance efficiencies.
The unique, patented way Tintri uses flash assures that clones are 100% performance efficient. They get the same level of performance as any other VM stored on a Tintri VMstore system.
Initially, new VMs created via cloning do not consume any significant space, since they are virtually identical to their respective parent VMs. The extent to which they individually grow and diverge from the data they share with their respective parents defines their incremental storage space requirements.
Using the Tintri UI, hundreds of clone VMs can be created at a time. Users can select an existing snapshot of a VM, or the live running state to create clone VMs. The clone VMs are automatically registered and visible to hypervisor for immediate use. Administrators can also select customization specifications defined in vCenter for preparing the newly-created clone VMs. Further, clones can also be created from template VMs for use cases such as provisioning, test and development, and virtual desktop infrastructure (VDI).
When cloning VMs from the Tintri VMstore UI, you can create clones from existing snapshots, or use the current state, where Tintri VMstore automatically creates a snapshot when you press the “clone” button.
You can use vCenter customization specifications (Tintri VMstore retrieves them from vCenter), and you can choose a specific vSphere cluster or vHost (ESX/ESXi server) to which you want to register and deploy the VM(s). Tintri VMstore automatically adds cloned VMs to your vCenter inventory for immediate use.
Replication
Unique to Tintri VMstore, ReplicateVM enables administrators to apply protection policies to individual VMs, rather than to arbitrary units of storage such as volumes or LUNs. ReplicateVM efficiently replicates the deduplicated and compressed snapshots of VMs from one Tintri VMstore to another. Replication can be dedicated to specific network interfaces, and optionally throttled to limit the rate of replication when replicating snapshots between Tintri VMstore appliances located in datacenters connected over wide-area networks.
The usefulness of ReplicateVM comes clearly into view when administrators realize the power they can wield by right-clicking on a VM and then quickly and easily establishing a protective snapshot and replication policy on each VM or VMs as needed.
Protection policies are applied to database server VMs running applications like Microsoft SQL Server, Oracle, SAP, and Microsoft Exchange. Distributing “Gold” (master/parent) VM images used to create desktop pools for VMware Horizon View or VM Catalogs for XenDesktop VDI deployments enables multi-site HA for VDI.
Accessing protected VM snapshots on the source or destination Tintri VMstore system is painless, due to seamless vSphere integration. As discussed previously, Tintri VMstore always adds newly cloned VMs to the vCenter inventory you specify, so that they are ready to be powered and into service immediately.
ReplicateVM is particularly powerful when it comes to replicating important, mission-critical data sets and assets essential to the operations of an organization. This includes but is not limited to protecting the core VM and application images used in server and desktop virtualization environments, and replicating the snapshots of those applications and images across multiple systems in geographically-dispersed data centers.
Array Offload
Installed on each vSphere server, the Tintri vStorage APIs for Array Integration (VAAI) plugin ensures that every VM in vCenter can leverage the fast, powerful, and space-efficient cloning capability of Tintri VMstore.
Using the vSphere client, administrators can right-click on a VM, and select “Clone VM” to start the Clone Virtual Machine wizard. The vSphere cloning operation leverages Tintri’s VAAI provider, which then delegates the cloning process to Tintri VMstore.
When vSphere receives a request to clone a VM, it inspects the VM’s datastore and checks to see if the datastore supports hardware acceleration. The Tintri VAAI provider plugin in each vSphere server serves as the intermediary between vSphere and Tintri VMstore. vSphere delegates the cloning operation to Tintri VMstore, and then communicates to vSphere through VAAI that the operation is complete.
Scripting VM cloning operations with PowerShell/PowerCLI or any other method that calls the vSphere APIs also leverages the Tintri VAAI provider, because vSphere interacts with datastores the same way, regardless of whether or not the command arrives from the vSphere client, PowerCLI, via a vSphere API call, etc.
Per-vDisk Auto-Alignment
VM alignment is a daunting to-do item. It is a problem that poses real challenges as virtualization spreads into more mainstream workloads. Misaligned VMs magnify IO requests, consuming extra IOPS on the storage array. At a small scale, the impact is small. However, the impact snowballs as the environment grows, with a single array supporting potentially hundreds of VMs. At this size, performance impact estimates range from 10% to more than 30%.
Every guest OS writes data to disk in logical chunks. Storage arrays also represent data in logical blocks. When a VM is created, the block boundaries on the guest OS and storage don’t always align automatically. If the blocks are not aligned, guest requests span two storage blocks, requiring additional IO.
A VM runs a guest OS that includes one or more virtual disks to store state. The guest OS typically defines the layout of each virtual disk with a common partition layout, such as a master boot record (MBR). The MBR stores information about how each virtual disk is partitioned into smaller regions, with its size and location. Except for Windows Server 2008 and Windows 7, blocks defined by the guest OS file system (NTFS, EXT3, etc.) do not typically align with the underlying datastore block layout.
Administrators attempt to address the misalignment issue by using a variety of utilities to manually align VMs and reduce performance demand. Numerous blogs, white papers, and knowledgebase articles describe why VMs should be aligned, and provide step-by-step instructions. Unfortunately, as administrators know, realigning a VM is a manual process that generally requires downtime.
Trintri’s application-aware file system intrinsically “understands” each virtual disk. Building on this foundation, Tintri VMstore offers VM auto-alignment. Rather than the conventional disruptive approach of realigning each guest, Tintri VMstore dynamically adapts to the guest layout. Nothing changes from the guest OS point of view. Tintri VMstore automatically aligns all VMs as they are migrated, deployed, cloned or created, with zero downtime. A VM administrator can now eliminate this arcane task and enjoy performance gains from 10% to more than 30%, with no VM downtime and zero user interaction.
vDisk and File-Level Restore
Unlike storage-centric snapshot technologies in legacy shared storage systems, Tintri per-VM snapshots make recovery workflows remarkably easy. Files from individual VMs can be recovered without additional management overhead, dramatically reducing the time to recovery.
Per-VM Quality of Service
Being able to set quality of service at the VM level allows an organization to guarantee each application its own level of performance and protect others by limiting their performance as well. These capabilities change the way you approach the tiering of storage. No longer do you need to plan out your storage-based tiers on different pools of storage capabilities. You can use the same pool of storage, but have distinct levels of service based on the settings that make the most sense for your applications. When automation is combined with this feature, it opens up capabilities for both enterprises and service providers.
For enterprises, per-VM QoS provides the ability to utilize a self-service portal to offer multiple performance levels. For most workloads, the default setting — no QoS assigned — allows the Tintri array to automatically adjust performance per VM. Workloads which need guarantees or specific limits can be configured to have these assigned per VM.
The option to expose QoS through a self-service portal is as simple as a dropdown. With traditional storage, VMs are required to be placed in the LUN or volume that matches the required storage tier. This requires decision workflows to determine if there is enough storage on a certain tier, or if policies for protection match that tier. Tintri VMstore systems eliminate the need for these workflows and decisions, because QoS and protection configuration are done at the VM level instead.
Service providers can build service tiers in which customer VMs automatically get a specific maximum throughput. This enables the option of charging for guaranteed IOPS.
By utilizing logic at the automation tier, customers can automatically be placed into per-VM configurations that limit the maximum amount of IOPS. If a customer would like a VM modified for a higher tier of storage performance, their actual blocks of storage do not need to be migrated to that tier, as they can be instantly adjusted to the level of performance desired. See Figure 1 for an example.
| Service Level | Maximum IOPs | Minimum IOPs | Cost |
|---|---|---|---|
| Default | 0 | 0 | $ |
| Tier 1 | 10000 | 5000 | $$$ |
| Tier 2 | 5000 | 0 | $$ |
| Tier 3 | 2000 | 0 | $ |
Figure 1. A possible matrix for self-service enterprise users.
Problems with Managing LUNs and Volumes
Virtualization introduces an element of simplicity and agility lacking in the physical world, providing administrators with a single view of resources under hypervisor control (CPU, memory, and networking).
Virtualization owes its success in transforming data centers to the power of abstraction; unhinging operating systems and their components from the confines and limitations of what is possible within the traditional physical world. An application within a virtual machine is, for the first time, a truly logical object. These objects can then be copied, reconfigured, redeployed, analyzed, and managed in ways that have been, and still are, very difficult for physical machines and infrastructure.
Virtualization not only provides the benefits of server and desktop consolidation, but also simplifies data center management, deployment, and maintenance. Unfortunately, there is still a language barrier in today’s modern data center. Most existing IT infrastructure and tools, including storage, don’t “speak” virtualization as their native language. This has the adverse side effect of obscuring the relationship between the virtualized application and the underlying infrastructure.
The entire industry has had to re-think traditional functions like monitoring and troubleshooting to account for virtualization, but not every element of the infrastructure has adapted. Virtualization has improved the cost and efficiency of managing servers, but significantly increased the time and complexity of managing, diagnosing, and fixing performance problems with storage.
No other component in a data center does a better job of illustrating this disconnect than shared storage systems.
Legacy shared storage systems that were designed well before the adoption of virtualization provide little help resolving performance problems with individual VMs. The result is a suboptimal infrastructure dominated by ever-escalating storage costs due to over-provisioning. According to VMware’s own estimates in 2010, storage accounted for up to 60% of virtualization deployment costs. Unfortunately, the situation hasn’t improved much since then.
In fact, traditional shared storage tends to amplify troubleshooting issues, via multiple opaque layers hidden from the VM administrator. Most shared storage systems operate with their own logical constructs, such as LUNs or volumes, which are mismatched with virtual resources like VMs and vDisks.
Additionally, migration technologies like vMotion drove the adoption of shared storage systems in the early days, as it was a basic requirement of VMware vSphere to have hosts that shared access to the same datastore (e.g., LUN or Volume) to be able to take advantage of this defining capability. Because of this requirement of virtualization, adoption of shared storage, both SAN (Fibre Channel or iSCSI) and NAS (NFS), accelerated.
However, traditional shared storage products present barriers to virtualization:
- They manage objects such as LUNs, volumes, or tiers, which have no intrinsic meaning for a VM.
- Legacy storage struggles to monitor, snapshot, set policies or replicate individual VMs.
This mismatch typically increases cost and complexity of the deployment as well as day-to-day operations. For example, each new VM must be assigned a specific storage LUN or volume upon creation. When IO requirements and VM behavior are not well understood, this becomes a painful trial-and-error process. Storage and VM administrators must coordinate with each other to ensure each application not only has the space it needs, but also sufficient IO performance for the expected load.
In most cases, multiple VMs occupy the same volume or LUN to reduce mapping complexity and take advantage of space-saving technologies like deduplication. However, this can lead to IO performance problems. A storage-centric view of performance data leaves out the details of the application or workload, and causes administrators to work backwards to determine which VMs are affected and which VMs are generating load.
Even more modern technologies like auto-tiering operate at the wrong level. Without the ability to report behavior on a per-VM or per-vDisk level, all the “advanced” storage technology seems to do is increase complexity and risk. Instead of the unvarnished VM model provided by hypervisors, legacy storage responds with a blizzard of options and interfaces.
In these situations, the complexity of configuring, managing, and tuning traditional storage for VMs is costly and ultimately limits the adoption of virtualization. In fact, many applications cannot be cost-effectively virtualized with legacy shared storage.
Inside The Box
Media Management
SSDs have taken the storage industry by storm by filling the ever-widening latency gap between other computing resources and hard drives. Every major storage vendor has a flash product now, but what is interesting is the differences in their approaches. Many initially rushed to market with flash as a read cache for disks. Others have used gold-plated SLC flash or even PCIe flash cards. Yet others have put together a tray of SSDs with an open-source file system.
These early products have been unable to deliver the full benefits of flash because they do not address the hard problems of flash, or are simply too expensive for mainstream applications.
The Hard Problems of Flash
SSDs behave very differently from hard disks. The main complexity lies in the Flash Translation Layer (FTL), which provides the magic that makes a bunch of flash chips usable in enterprise storage. The FTL handles wear leveling, ECC for data retention, page remapping, GC, write caching, managing internal mapping tables, etc. However, these internal tasks conflict with user requests and manifest as two main issues: latency spikes and limited durability.
Latency
The main appeal of SSD is its low latency; however, it is not available consistently. And while write latency can be masked with write-back caching, read latency cannot be hidden. Typical SSD latencies are a couple of hundred microseconds, but some accesses can be interrupted by device internal tasks, and their latency can exceed tens of milliseconds or even seconds. That’s slower than a hard disk.
There are myriad flash internal tasks that can contribute to latency, such as GC at inopportune times or stalling user IO to periodically persist internal metadata. What further complicates the situation is the lack of coordination across an array of devices.
The most common way to use SSD is to configure a group of devices, typically in RAID 6. But since each device is its own eco-system completely unaware of others, the resultant performance of IOs to this array can become even more unpredictable since their internal tasks are not coordinated.
Unless the storage subsystem understands the circumstances under which latency spikes occur and can manage or proactively schedule them across the entire array, the end result will be inconsistent and have widely varying latency characteristics.
Endurance
Although flash is great for IOPS, it has limited write cycles compared with a hard disk. And while SLC flash drives have higher endurance compared with MLC, they are too expensive for mainstream applications, and may still require over- provisioning to control write amplification. MLC flash is much more cost-effective, but if used natively will quickly wear out. Its lifetime is proportional to the amount of data written to it by both user as well as data produced by internal drive activity such as GC, page remapping, wear leveling, or data movement for retention.
The additional data written internally for each user write is referred to as write amplification, and is usually highly dependent on device usage patterns. It is possible to nearly eliminate write amplification by using the device in way that hardly ever triggers GC, but the techniques are not widely understood and may be drive-specific. Techniques for total data reduction such as dedupe and compression are more widely known, but hard to implement efficiently with low latency. Similarly, building a file system that has a low metadata footprint and IO overhead per user byte are also challenging, but yields high benefit.
Reliability
One of the key requirements for enterprise storage is reliability. Given that write endurance is a challenge for SSD and the fact that suboptimal use patterns can further affect it, it is important to predict when data is at risk. SSD has failure modes that are different from hard disks. As SSDs wear out, they begin to experience more and more program failures, resulting in additional latency spikes. Furthermore, because of efficient wear leveling, SSDs can wear out very quickly as they near the end of their useful life.
It is important to understand when a device is vulnerable. This is not a simple matter of counting the number of bytes written to the device and comparing it with its rating. It means observing the device for various signs of failure and errors and taking action.
The bottom line is that SSD is a game changer, but needs to be implemented correctly in any storage system, and won’t be as effective if it’s bolted onto an existing system. If you’re evaluating any SSD storage products, make sure you understand how the file system uses flash and manages performance, latency spikes, write endurance and reliability.
SSD Drive Modeling
Flash storage can deliver 400 times greater raw performance than spinning disk, but leveraging it introduces the need for fundamental architectural changes. For comparison, the speed of sound — 768 mph at sea level — is “only” 250 times faster than the average speed of walking. To travel at supersonic speeds, engineers designed sophisticated aircraft systems specifically for high speeds. It may be possible to strap a rocket motor to one’s back and attempt to travel at 768 mph, but the result would be less than ideal.
Flash poses similar challenges to existing storage systems. MLC solid- SSDs are currently the most cost-effective approach and provide excellent random IO performance, but have several idiosyncrasies which make it unsuitable as a simple drop-in replacement for rotating magnetic disks.
Disk-based systems were created more than 20 years ago to cope with a decidedly different set of problems. Adapting these systems to use flash efficiently is comparable to attempting to adapt an 8-bit single-threaded operating system to use today’s multicore 64-bit architectures.
The Tintri VMstore appliance is designed from scratch to fully exploit flash technology for virtual environments. The custom Tintri OS is specifically designed to ensure robust data integrity, reliability, and durability in flash. MLC flash is a key technology that enables Tintri to deliver the intense random IO required to aggregate hundreds or even thousands of VMs on a single appliance.
Performance Characteristics
Flash drives are programmed at the page level (512B to 4KB), but can only be erased at the block level (512KB to 2MB); sizes much larger than average IO requests. This asymmetry in write vs. erase sizes leads to write amplification, which, if not managed appropriately, creates latency spikes. Tintri employs sophisticated technology to eliminate both the write amplification and latency spike characteristics of MLC flash technology. This approach delivers consistent sub-millisecond latency from cost-effective MLC flash.
Tintri VMstore leverages the strengths of MLC flash while circumventing its weaknesses, providing a highly reliable and durable storage system suitable for enterprise applications.
Endurance Characteristics
MLC flash, in particular, can be vulnerable to durability and reliability problems in the underlying flash technology. Each MLC cell can only be overwritten 5,000 to 10,000 times before wearing out, so the file system must account for this and write evenly across cells.
Tintri uses an array of technologies including deduplication, compression, advanced transactional and GC techniques, and SMART (Self-Monitoring, Analysis and Reporting Technology) monitoring of flash devices to intelligently maximize the durability of MLC flash. Tintri also employs RAID 6, which protects systems against the impact of potential latent manufacturing or internal software defects from this new class of storage devices.
Although MLC is two to four times cheaper than its cousin SLC, it’s still about 20 times more expensive than SATA disks. To use flash cost efficiently, technologies like inline deduplication and compression are critical.
By design, nearly all active data will live exclusively in flash. To maximize flash usage, Tintri combines fast inline deduplication and compression with file system intelligence that automatically moves only cold data to slower media.
Inline deduplication and compression are also highly effective in virtualized environments where many VMs are deployed by cloning existing VMs, or have the same operating system and applications installed. Tintri VMstore flash is neither a pure read cache nor a separate pre-allocated storage tier. Instead, flash is intelligently utilized where its high performance will provide the most benefit.
SSD-Specific Optimizations
FlashFirst design uses a variety of techniques to handle write amplification, ensure longevity and safeguard against failures, such as:
- Data reduction using deduplication and compression. This reduces data before it is stored in flash, resulting in fewer writes.
- Intelligent wear leveling and GC algorithms. This leverages not only information on flash devices, but also real-time active data from individual VMs for longer life and consistently low latency.
- SMART (Self-Monitoring, Analysis and Reporting Technology). This monitors flash devices for any potential problem, issuing alerts before they escalate.
- High performance dual parity RAID 6. This delivers higher availability than RAID-10 without inefficiency of mirroring, or the performance hit of traditional RAID 6 implementations.
Data Integrity
Like any modern file system, the Tintri file system employs various techniques to maintain the end-to-end integrity of the data stored within. There are numerous causes of data integrity loss:
- Storage media degradation
- Reading/writing to incorrect locations on the media
- Memory corruptions
- Errors during data transfer over interconnects
- Software bugs
A set of basic error checks are employed within hardware that try to protect data at the individual component level. The storage media itself has the ability to indicate if a particular data block was corrupted due to device degradation. In addition, communication protocols like PCIe or SCSI takes care of the checksumming of the data at endpoints to protect against bit flips. Also, the system memory has its own error checking and correction codes to ensure that its integrity is maintained.
Integrity of data is checked at various stages throughout the Tintri file system:
- Data and metadata pages during access
- Data segments are scrubbed periodically for object validity
- RAID stripes are validated periodically
- NVRAM data is validated before replayed to disk
- File and snapshot checksums are validated prior to deletion
Overall, the Tintri file system was designed with an exhaustive set of mechanisms to ensure complete end-to-end data integrity for the entire storage system. These include things like:
- Internal checksum or hashes for self-validation of objects
- Compressed blocks written to media (e.g., flash and hard disks)
- Compressed metadata pages written to flash
- RAID objects that contain multiple compressed metadata blocks and data pages
- NVRAM data blocks
- Mirrored state to standby controllers
- External checksums or hashes for objects stored within references
- Block or extent metadata containing pointers to compressed data blocks
- Transactional updates for files or snapshots that store cumulative hashes
- Clones and snapshots inherit content, checksums, and hashes from parent objects
An individual data block may be unreadable if bits are flipped on the storage medium or if there are firmware errors. Drives generally suffer from many types of failures, such as silently losing a write, writing a block to an incorrect location, or reading data from an incorrect location. File systems must be able to detect and correct errors. Tintri OS’s RAID 6 software detects and self-heals errors in real-time.
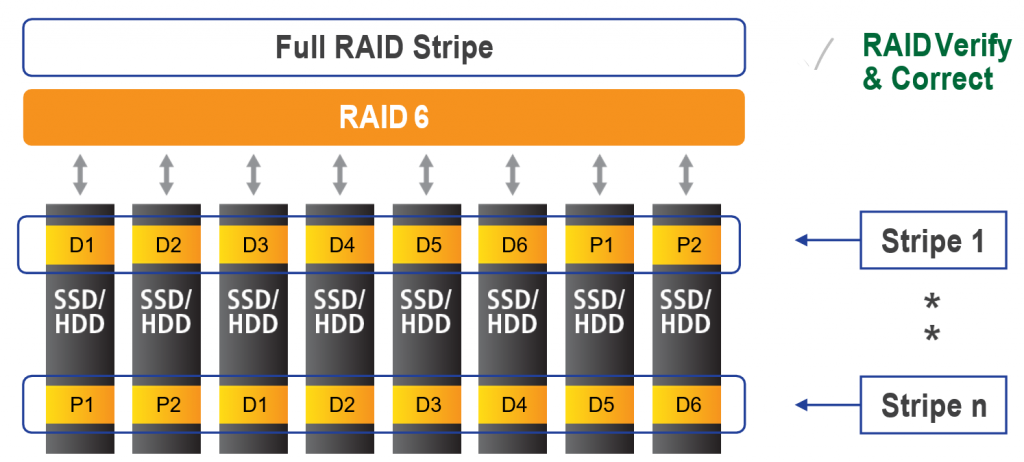
Figure 2. Tintri’s RAID 6 configuration.
The underlying file system of the Tintri OS stores all of the objects it manages — metadata and data — in blocks with strong checksums. On every read, the file system first verifies the object read from disk by computing checksums and ensuring the computed value matches what is retrieved. If an issue is found, RAID 6 corrects and self-heals the system. See Figure 2 for more information.
When Tintri OS receives a write request, after analyzing for redundancy, it stores the data block along with its checksum on SSD. For a duplicate block, a read is issued for the existing block from flash to ensure a match. A checksum is computed and stored with each data object — both in flash and on disk— and verified whenever the object is read. A self-contained checksum may be valid if a drive substitutes one read for another because of DMA errors, internal metadata corruption, etc. This means an inline checksum by itself cannot catch all device errors.
A referential integrity check is needed to detect corruption, to avoid bigger issues by returning incorrect data. To ensure referential integrity, references to data objects contain a separate checksum that is verified against the checksum of the object being read.
These techniques ensure the data on SSD and HDD are readable and correct, and the file system metadata used to locate data is readable and correct. Potential problems, such as a disk controller returning bad data, are caught and fixed on the fly.
Logical File Contents, Verified on Deletions and in Replication
RAID-assisted real-time error detection works well for active data, but does not address errors with cold data, such as data blocks referenced by snapshots for long periods of time. To guard against corruption, VMstore appliances actively re-verify data integrity on SSD and HDD in an ongoing background process.
For data stored on HDD, there are two levels of scrub process to identify and repairs errors:
- As new data and its checksums are written, a background process reads entire RAID stripes of data written to disk and verifies checksums for If there is an error, RAID heals the system in real time. This helps correct transient errors that may occur in the write data path.
- A weekly scheduled scrub process that requires no user intervention re-verifies all data stored on disk, ensuring any errors are detected and This helps correct cold-data errors.
For data stored on SSD, a continuous scrub process runs in the background to read full RAID stripes of data at fixed-time intervals, and compares computed checksums. If there is an error, RAID corrects errors in real time. Checksums for each data object inside the RAID stripe are also computed independently and matched with what is retrieved from SSD.
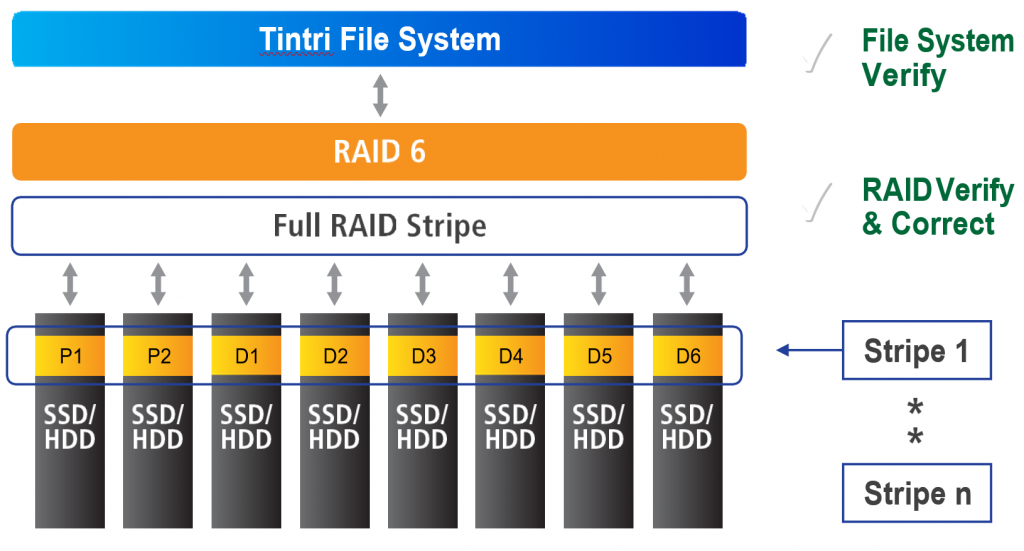
Figure 3. Tintri RAID 6 error correction.
Through RAID 6 real-time error correction and ongoing scheduled data scrubbing, most storage-medium generated errors are identified and fixed with no impact to file system or storage system operation. The process is shown in Figure 3.
Tintri’s file system stores data on SSD (in blocks) and on HDD (in extents). The metadata that describes the data is stored on SSD (in pages organized in page pools). Every object – data block or extent and metadata page – has a checksum and a descriptor (the self-describing module of an object). The descriptor of a data object describes the file and the offset in that file the object belongs to; and similarly, the descriptor of a metadata page describes the page pool to which a metadata object belongs and whether it is the latest version.
Tintri file system stores checksums that tie an object and its descriptor, so that lost writes, misplaced reads, or other such perfidious errors do not corrupt data (Figure 4). The self- describing nature of data and metadata helps recover from disk and firmware errors.
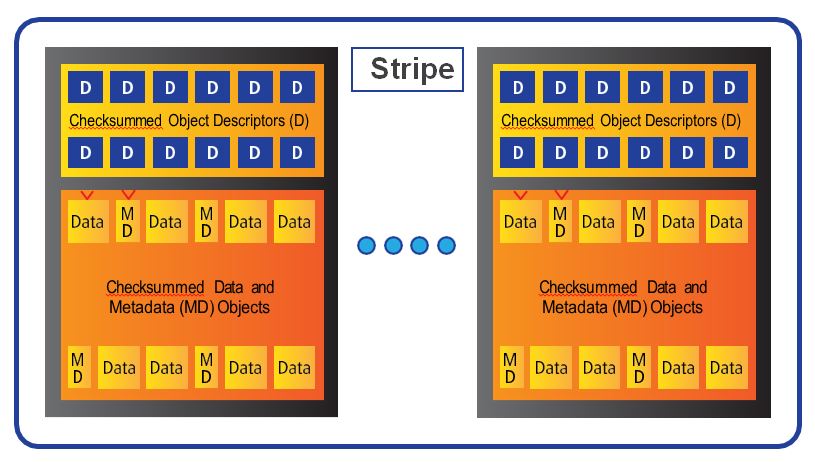
Figure 4. Tintri file system checksum overview.
The Tintri file system consists of a hierarchy of references with blocks and extents at the lowest level and metadata mapping them at higher levels. Referential integrity is maintained at each level using strong checksums to detect errors. The checksums defend against aliasing issues such as a file pointing to wrong data blocks. Further, metadata objects have a version number in metadata pages to detect similar aliasing issues.
Data blocks and extents are written to SSD and HDD, respectively, in full RAID stripe units. Techniques described in self-healing file system detect and correct errors with cold data. In the unlikely event that an unrecoverable disk error causes orphaned or corrupt objects, a scan of the self-describing objects helps detect and correct the problems.
High Availability
RAID
While RAID technology has existed for decades and most storage companies have built their own RAID subsystems, the existing technology was all designed for disk-based systems. The adoption of solid state media into the mainstream changed a lot of design considerations in the storage stack. In the early stages of the design, we knew that the RAID subsystem needed to be designed with SSDs in mind, and that it would need to be a lot more sophisticated than previous designs. A later section discusses the challenges of early SSDs as well as newer challenges as SSDs evolved.
The Tintri RAID subsystem is built in the user-space file system; it is not in the kernel. The main disadvantage of this choice was that this RAID module could not be used for managing the OS disks and partitions, and depended on the Linux kernel ‘md’ RAID subsystem. However, the advantage was that it allowed a faster development time, a very sophisticated module, a tight integration with the rest of the file system, a lot more control over performance, and a much better turnaround time with debugging and feature addition.
The Tintri RAID module implements RAID 6, which is the default RAID level shipped on all Tintri systems. Its RAID 6 (dual parity) is implemented in a way that results in a very fast RAID subsystem. The parity is rotated across all the drives participating in the stripe, so that that IO load can be evenly distributed. It always performs only a full stripe write. This avoids errors from in-place updates, as well as eliminates the potential for overhead from write-amplification due to small random writes needing corresponding parity to be updated.
The stripe itself may be smaller than the RAID group size. So, for example, a RAID group of 20 disks may have a stripe length of 10+2. The RAID group headers are updated using a Paxos-based consensus protocol; the RAID never loses its brains, no matter how many drive push, pull or mixups are performed.
In addition to storing data, the RAID module also provides some auxiliary functions: It provides APIs to store small blobs of metadata to other interested subsystems, with the ability to perform atomic updates to them using the consensus protocol built within the RAID module. This is used by many modules to store, update, and retrieve small metadata like superblocks, at a low level. There is a rich API set, both internal and network-based, for querying all of the internal state like drive state, rebuild status, etc.
The IO Stack
The IO stack of the RAID module is specifically designed to meet the needs of SSDs while also managing HDDs. The entire stack is designed to be very low latency. There is a proportional scheduler built into the stack for the many “principles” that submit IO to the RAID module. The principles can be user read or write, metadata read or write, garbage collection read or write, scrub, scanners, etc. Each of these principles have a different priority in the system, and have different goals; they may be low latency or high throughput.
An independent subsystem may manage its own IO stack and queue to the RAID module to meet its performance goals. The RAID module then schedules between them to meet the overall performance goals, from the drives, at the system level.
The entire RAID stack is asynchronous; threads don’t block inside the RAID module. The IO pipeline is carefully managed for high throughput, and also for providing low latency for random reads (the low write latency comes from the use of NVRAM/NVDIMM).
As discussed in a later section, SSDs generally provide low latency to random reads, but can sometimes incur a high latency in the presence of writes. Tintri RAID associates a small timeout value (in ms) with every asynchronous read of high value (like user data read) and reconstructs the read from other devices if the current device being read from exceeds the latency threshold.
Additionally, the RAID subsystem performs device management at the group level to increase the possibility that no more than one device may incur latency spikes at a given time. The information needed to perform this kind of management is developed by characterizing the performance and behavior of each SSD model (discussed in more detail later). This combination of device- and group-level management of SSDs leads to consistently low latencies.
Rebuild
There is usually one or more spare associated with Tintri storage systems. An external module, called PlatMon, determines which spare must be used for a given degraded RAID group. While a device is in the ‘spare’ state, it is not managed by RAID. When a spare is provided to RAID, after validating that the drive is in good state, it is immediately used for rebuilding. Thus, a drive within a RAID is either in good state, missing state, failed state or rebuilding state.
The drive rebuilds are performed in a circular fashion. E.g., if there are a 1000 stripes and there is one drive failure and it has rebuilt to the first 300 stripes and a second drive failure occurs, then the second drive starts rebuilding at the same offset as the currently rebuilding first drive: stripe #300. When all the stripes are done rebuilding on the first drive, the second drive will have rebuilt stripes 300 to 1000. At this point we circle back to rebuilding stripes 1 to 299 on the second drive. This optimization is present for two reasons:
- Independently rebuilding each drive from independent offsets has higher read overhead in terms of data read.
- HDDs are not efficient with random seeks, so it is better to coordinate the offsets being read for the two rebuilds. HDDs are present on the hybrid storage platforms, therefore it is important to optimize for them.
Another rebuild optimization: only previously written stripes are ever rebuilt. If an SSD happens to fail or is pulled out for testing on a newly deployed system with only a few GBs of data written, the failed SSD will rebuild in a matter of minutes.
SSD Profiles
There is a profile stored for each SSD model type in the RAID subsystem. SSD products from different vendors vary in performance, endurance, write amplification, and latency profile. These characteristics also vary between models from the same vendor.
To account for these differences and deliver the highest availability and performance possible, Tintri studies the SSD then builds a profile that is most efficient for that SSD. The profile specifies max IO sizes, write pattern, queue lengths, read and write timeouts, latency optimizations, etc. for a given model. The RAID subsystem detects the drive model at runtime and applies the appropriate model to it. There are dozens of saved profiles in Tintri’s RAID groups.
Stripe Integrity
Each stripe unit header carries a checksum of the stripe unit payload. In addition, each stripe unit carries metadata relating it to other units of the stripe and to the RAID group itself. Together, this information can be used to detect errors like bit flips, corruption, lost writes, misplaced writes, wrong offset reads or swapped writes at the RAID level.
Expansion
The Tintri RAID groups are expandable. A RAID group may start out at size 10+2 and be expandable to 20+2. The purpose of expansion is to be able to add capacity without increasing the RAID parity overhead; instead of adding a new RAID group, the current RAID group is expanded.
Given the high density of modern SSDs, a single storage system with 24 slots can house more than 200 TBs of raw SSD capacity; and soon, those numbers will increase to more than 400, with 16TB SSDs.
In a high-density scenario, creating multiple RAID groups from multiple SSD shelves does not make a lot of sense; beyond a certain capacity the controller becomes a bottleneck and is unable to serve more data. The range of capacities that can be addressed with 24 slots of high density SSDs is very large. This is the reasoning behind the choice to design the RAID system to support dynamic expansion.
RAID expansion occurs without any overhead or downtime. After new disks are added, the expansion task is initiated, which will instantly add the new devices to the current RAID group. Expansion can occur one disk at a time, or with as many as 12 at a time.
Dual Controller Architecture
Tintri VMstore appliances have dual-controller architecture to provide high availability to storage consumers, and Tintri OS incorporates a number of data integrity features in its high availability architecture. The Tintri file system syncs data from the NVRAM on the active controller to that on the standby controller to ensure file system contents match. A strong fingerprint is calculated on the contents of NVRAM on the primary controller as data is synced and then verified with the fingerprint calculated independently by the secondary controller.
When Tintri OS receives a write request, data is buffered into the NVRAM device on the primary controller and forwarded to the NVRAM device on the secondary controller. After acknowledgement from the secondary controller that data was safely persisted on its NVRAM, the primary controller acknowledges the write operation to the hypervisor. This, combined with techniques discussed in NVRAM for fast buffering and fail protection, ensures controller failures have no impact on data integrity.
High Availability Deep Dive
For a deep dive on more design features that keep the system available and protect the integrity of data, see Appendix I: High Availability Deep Dive.
Performance and Quality of Service
End-to-end View
Raw Performance
The first generation of commodity SSDs was at least two orders of magnitude faster than HDDs for random reads. But they were not without problems; the random write case was more complex.
The random write performance was not as good and had latency spike issues that the SSD FTL took many generations to improve. Even sequential write performance, although much higher, had latency problems in the steady state.
Related to this is the fact that the density of the first generation of SSDs was not as high as HDDs. Many applications access a certain amount of data before they reach a certain level of performance. In other words, a minimum space density is needed to drive minimum performance needs, from the application perspective. Here again, it was anticipated that the SSD space density would grow steadily over time. And so, even if applications would not drive the first generation of SSD-based storage as hard, they would eventually drive stronger performance as a lot more data would become concentrated in a single SSD.
Tintri understood that simply taking current-generation architectures and ideas developed for HDDs and running them on SSDs would produce some performance benefit; but it would be necessary to design from the group up to deliver the maximum performance benefit of high IOPS at consistently low latencies. It also foresaw that SSD performance would grow massively, and that eventually a full array of SSDs would easily outstrip the performance available on the controller. At that point, the CPU would become the bottleneck.
Managed Performance
Another axis of thinking about performance is managed performance. This is different from the highest raw performance one can extract from a storage system. Given a fixed amount of performance that a storage system can produce, how should this performance be shared between the many applications (VMS) running on it? Not all applications have the same performance needs: some are throughput driven, and some need the lowest latencies.
Not all applications are equal: some are more important than others in the data center, and when the total performance demands exceed availability, they have to be prioritized.
Additionally, not all applications are the best neighbors. Write-intensive applications may better co-exist with more read-intensive applications than other write-intensive applications.
Finally, not all performance problems originate at the storage level. It is very common for the source of nagging performance problem to be a misconfigured network, settings at the switch, hypervisor host settings, or even the VM-level CPU or memory settings.
Building performance isolation and guarantees is not simple and cannot be just bolted onto an existing storage architecture; the techniques run deep into the storage stack. Not only do IOs need to be proportionally scheduled by principle when they are received, the scheduling by principle needs to happen throughout the stack. Individual IOs must be tracked by its principle deep into the storage stack. Statistics at all layers of the storage stack must be maintained at the IO level. And, of course, the statistics need to feed into a model that can produce the desired results.
The performance aspect of the Tintri storage system was designed with several requirements in mind:
- The high performance of SSDs
- The expectation that it will become even faster and lead to millions of IOPS at the whole array level
- The challenges of flash management
- The need to provide proper performance isolation at the VM level
- The need for diagnosing performance issues end-to-end
VM Performance
By monitoring IO requests at the vDisk and VM level and integrating with vCenter APIs, Tintri VMstore knows the identity of the corresponding VM for each IO request, and can determine if latency occurs at the hypervisor, network, or storage levels.
For each VM and vDisk stored on the system, IT teams can use Tintri VMstore to instantly visualize where potential performance issues may exist across the stack. Latency statistics are displayed in an intuitive format. In an instant administrators can see the bottleneck, rather than trying to deduce the location from indirect measurements and time-consuming detective work.
Administrators can detect trends with data from VMstore and individual VMs, all without the added complexity of installing and maintaining separate software. This built-in insight can reduce costs and simplify planning activities, especially around virtualizing IO-intensive critical applications and end-user desktops.
To handle monitoring and reporting across multiple VMstore systems, Tintri created Tintri Global Center (Figure 5). Built on a solid architectural foundation capable of supporting more than one million VMs, Tintri Global Center is an intuitive, centralized control platform that lets administrators monitor and administer multiple, geographically-distributed VMstore systems as one. IT administrators can view and create summary reports across all or a group of VMstore systems, with in-depth information on storage performance (IOPS, latency, throughput), capacity, vCenter clusters, host status, protection status and more.
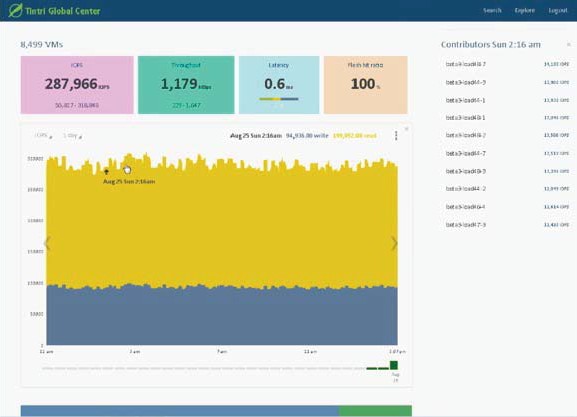
Figure 5. Trintri Global Center.
In addition to summary information presented at a glance, Tintri Global Center also provides the ability to filter and display results, including by individual VMstore systems and specific VMs, for easy troubleshooting.
Handling Spikes In Device Latencies
Tintri VMstore integrates flash as a first-class storage medium rather than as a bolt-on cache or tier, to fully leverage continued improvement in flash price and performance. Using flash as an intelligent, highly granular resource — combined with inline deduplication, compression and a unique flash/disk file system — enables Tintri VMstore to radically alter the economics of server virtualization.
Tintri’s innovative FlashFirst design addresses MLC flash problems that previously made it unsuitable for enterprise environments. Flash suffers from high levels of write amplification due to the asymmetry between the size of blocks being written and the size of erasure blocks for flash. Unchecked, this reduces random write throughput by more than 100 times, introduces latency spikes and dramatically reduces flash lifetime.
FlashFirst design uses a variety of techniques including deduplication, compression, analysis of IO, wear leveling, GC algorithms and SMART monitoring of flash devices and dual parity RAID 6 to handle write amplification, ensure longevity and safeguard against failures.
VM QoS: Tintri VMstore is designed to support a mixed workload of hundreds of VMs, each with a unique IO configuration. Additionally, as volumes of traffic ebb and flow, VMstore through its FlashFirst design analyzes and tracks the IO for each VM, delivering consistent performance where it is needed.
This enables VMstore to isolate the VMs, queue, and allocate critical system resources such as networking, flash/SSDs and system processing to individual VMs. Tintri VMstore’s QoS capability is complementary to VMware’s performance management capability. The result is consistent performance where needed. And all of VM QoS functionality is transparent, so there is no need to manually tune the array or perform any administrative touch.
QoS is critical when storage must support high-performance databases generating plenty of IO alongside latency-sensitive virtual desktops. This is commonly referred to as the noisy neighbor problem in traditional storage architectures that are flash-only and lack VM-granular QoS. Tintri VMstore ensures database IO does not starve the virtual desktops, making it possible to have thousands of VMs served from the same storage system.
QoS Design Principles and Methodologies
QoS is an end-to-end problem. For application-originated IO, the same level of service needs to be delivered at various levels of the IO stack (guestOS, hypervisor, network, storage).
Typically, storage appliances are unaware of VMs, but Tintri is an exception. Because of Tintri’s tight integration with hypervisor environments like VMware, Hyper-V, etc., the Tintri file system has information about the VMs residing on it. With this VM information, the Tintri file system can distinguish between IOs generated by two different VMs. This forms the basis for providing per-VM storage QoS in the Tintri file system.
QoS and Performance Isolation
The default QoS policies, which provide automatic performance isolation between VMs, is sufficient for the vast majority of applications. Adjusting the QoS settings may be necessary to handle the small minority of cases where tuning is required in order to address specific performance problems or to guarantee Service Level Agreements (SLAs).
A maximum setting specifies the maximum normalized IOPS a VM can achieve, and can be used to implement SLAs or protect other VMs in the system from rogue VMs. The throughput of a VM without a maximum setting is not limited. The effect of reducing maximum normalized IOPS on individual VMs is an increase in the throttle latency experienced by the VM.
You may want to adjust the maximum settings for the following reasons:
- A VM is getting more IOPS than needed. You may want to decrease the maximum limit to provide a lower level of service.
- You are concerned that a specific VM may use up too many resources on the system. You may want to decrease the maximum limit.
- After setting the maximum limit, you find the VM performance to be worse than expected and decide to increase the maximum limit. You can see this by examining the throttle latency on the VM.
A minimum setting specifies the share of performance resources a VM will be allocated when the system is overloaded. The minimum setting offers a path to provide additional performance protection in the presence of competing VMs. Generally speaking, as long as the system-provisioned normalized IOPS (the sum of all provisioned minimum settings, made visible in the Configure QoS dialog box) is less than 100%, each VM will be able to achieve at least its minimum IOPS setting. The minimum setting becomes effective as the system becomes overloaded. If the system is not overloaded, there are enough IOPS for everyone, so a minimum setting has little effect.
In order for a VM to benefit from a minimum setting, it must be generating a sufficient queue depth. (Note that a minimum setting is not a magic bullet for increasing the performance of your VM. If a VM issues little or no IO, then increasing the minimum setting will provide little benefit.)
When the system is 100% utilized, a VM will receive sufficient resources to achieve its target minimum setting. When the system is less than 100% utilized, VMs will be able to receive more than their minimum settings (i.e., leverage some of the free performance reserves). When the system is 100% utilized, a VM with a higher minimum setting will be allocated proportionally more IOPS than a VM with a lower minimum setting.
To ensure that VMs meet their minimum settings, you should not over-allocate minimum IOPS (each Tintri model has a supported normalized IOPS rating which is generally less than the highest IOPS that the system can achieve). This is made visible to the user in the Configure QoS dialog box.
Certain types of normalized IOPS are more expensive to service than other types of IOPS. Writes are more expensive than reads. Small requests are more expensive than large requests. Flash misses are more expensive than flash hits. A VM issuing larger requests can cause average flash latency to increase, in which case it helps in throttling those VMs so that the VMs performing IOs of smaller request size can meet their minimum normalized IOPS.
When the system is 100% utilized, some VMs may not get desired throughput. Common reasons include: high sequential reads or writes due to provisioning, backup or scans, and/or running very high IOPS applications such as databases.
Examine the latency breakdown for the VMs that are not getting the desired throughput and verify there is significant contention latency. If so, increasing the minimum setting should decrease contention latency and increase throughput.
If other VMs running at the same time and contending for resources have high minimum settings, consider reducing the minimum settings for those VMs or setting a maximum on those VMs.
Remember that given two throughput-intensive VMs, when the system is 100% utilized then normalized IOPS will be allocated in proportion to their minimum settings.
Storage QoS on a broader scale can be categorized into two main areas: space sharing and performance sharing. This chapter will focus on two of the most important use-cases of performance sharing.
Performance Isolation
This is a way of isolating one VM’s IO traffic from another VM. This is essential in virtualized environments because multiple VM users can run different kinds of applications, and one VM user should not be affecting the IO performance of the other.
Tintri Storage QoS uses the built-in VM-awareness to implement per-VM performance isolation. QoS scheduler maintains an IO queue per VM, before they are admitted into the file system read/write pipeline. A proportional scheduler is implemented that uses the VM’s IO request-size and per-request overhead to determine the cost of every IO in the system. It also keeps track of the total outstanding IOs in the read/write pipeline, and schedules the VM’s IOs from the queue proportionally into the pipeline for execution.
Performance Protection
This is a way of providing service levels in a virtualized environment where service providers charge the end-user based on a pre-defined performance consumption metric.
Performance service levels on a VM are assigned by setting a minimum and maximum cap on performance metrics, like normalized IOPS or Throughput. Minimum cap on a VM guarantees at least the specified performance service level for a VM, and Maximum cap on a VM guarantees no more than the specified performance service level for a VM. At times, service levels are used to solve the noisy neighbor problem.
Tintri Storage QoS provides performance protection for VMs, using minimum and maximum performance settings on a per-VM basis. As shown in Figure 6, VM #1 is a rogue VM and the user wants to throttle it. In such cases, the user would set maximum IOPS on the VM. In contrast, VM #5 is deemed an important VM. In such cases the user would set minimum IOPS on the VM. normalized IOPS (with IOs normalized at 8KB) is the unit used for minimum and maximum IOPS settings.
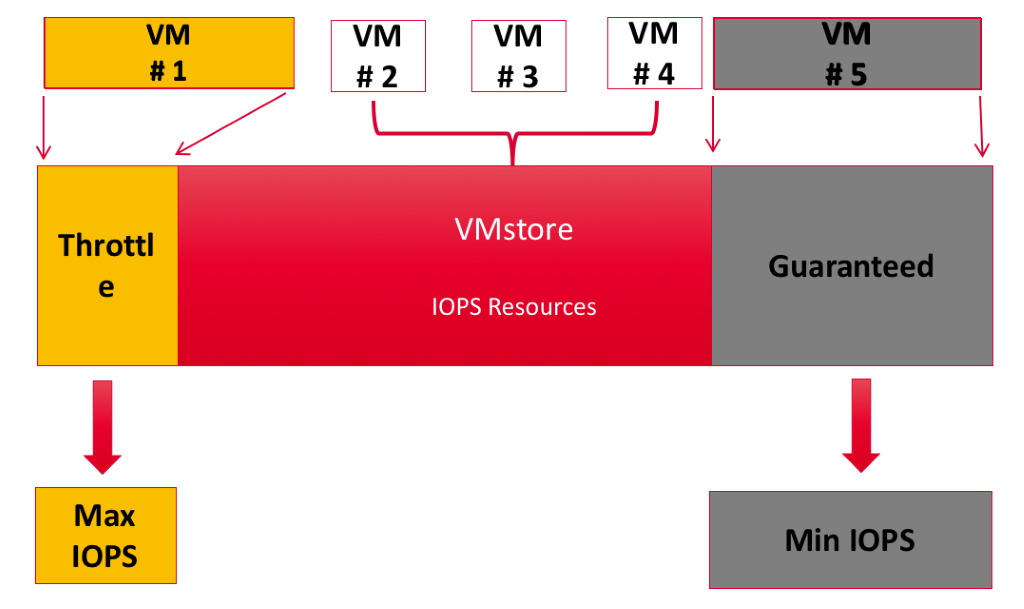
Figure 6. Throttling a rogue virtual machine (VM #1).
Performance protection also gives rise to a set of complexities in which some VMs have service levels set and others do not have any service levels set. This can cause an imbalance between system performance resource allocations, thus causing starvation.
User expectations from guaranteed service levels are heavily dependent upon the amount of system resources available. Every storage appliance has an upper limit on performance it can deliver. Different IO workloads can lead to different performance characteristics. Hence, Storage QoS should be able to inform the user if they have overprovisioned the storage system.
Using the right performance metric is critical in setting per-VM storage QoS policies of minimum and maximum. IOPS, although a widely used metric, does not gauge the performance measures correctly. This is because a VM’s IO request size can differ. Throughput is a more realistic performance gauge. If a user is more comfortable with using IOPS as a metric, then Normalization of IOPS is needed. This calls for a transition from an actual IOPS to normalized IOPS, and storage should provide appropriate visualization, to help understand this normalization.
Storage QoS is complicated, and without the right set of tools to troubleshoot, the desired effect won’t happen, as implementing Storage QoS can directly impact latencies experienced by the VMs. Detailed latency breakdown and its visualization becomes a necessity to troubleshoot problems related to QoS.
In addition to external components, which is the VM’s IO traffic in our case, there are several internal components running on a storage appliance that consume performance resources. Examples include Garbage Collector on a Log Structured file system, Flash Eviction on a Hybrid System, Raid Rebuild, etc. It is essential to isolate performance of these internal components from each other and from the external component. It is essential to give the internal file system components a performance service level, so that they do not get starved themselves or gobble up all the performance resources from user VMs.
Throttling Rogue VMs
Multiple VMs from multiple hypervisors can generate a mix of IO patterns, thus causing the “IO Blender” effect, where a rogue VM can cause a negative impact on the performance of other VMs.
To solve this problem, the storage must throttle the rogue VM so that other VMs do not suffer. If the storage decides to throttle the VM too soon, it will not keep all the system resources busy, thus not achieving the maximum throughput the system is capable of.
If the storage decides to throttle the system too late, it will run into the same problem when the rogue VM eats up the resources, thus making the other VMs suffer. Hence, it is very important for storage to find out the point at which it must start throttling the rogue VM, and provide fairness in the system without leaving any performance resources unused.
For Tintri storage QoS, this point is the maximum performance a given VMstore appliance can deliver for a given kind of workload. However, it is impossible to come up with one number that would fit all the different kinds of workloads.
This is because different IO workloads have different patterns, as a combination of request-size, queue-depth, dedupe, compression, zero-blocks, etc. Also, in hybrid systems some blocks might be cached in SSD for high performance and some cold blocks remain on HDD, thus causing a mix of performance characteristic. That makes it hard to answer the question, “Has the storage subsystem been overprovisioned on performance?”
Tintri has solved this puzzle so that the customer does not need to do any guessing. As shown in the figure below, latency and throughput for a system tend to increase only to a point; the point where the throughput won’t increase but the latency will.
Tintri Storage QoS finds this point of diminishing returns for the current IO workload as a function of request-size, queue-depth, dedupe, compression, and SSD/HDD distribution of the current IOs. After the system has reached the point where throughput will not increase, the QoS scheduler’s enabled, and it will schedule IOs between multiple VMs.
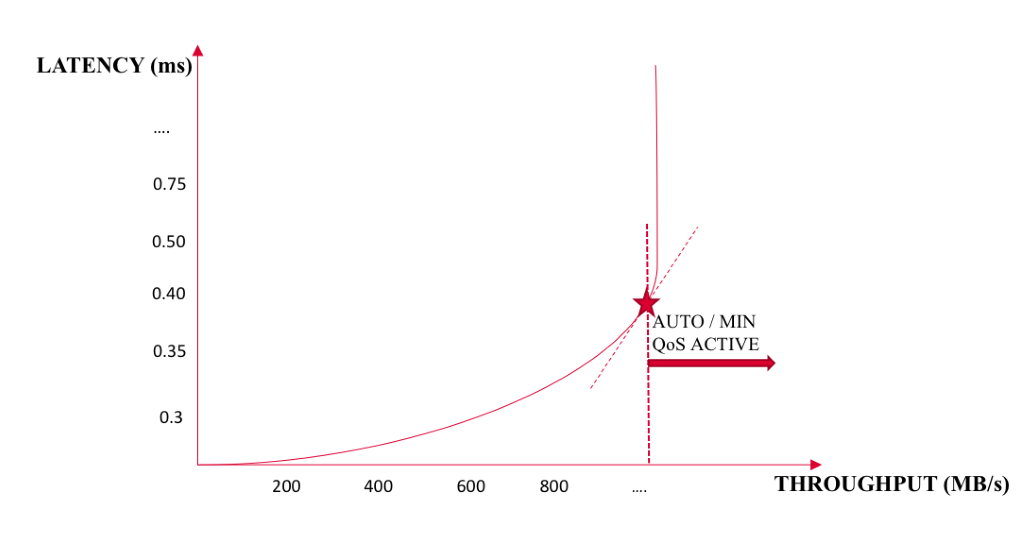
Figure 7. Latency vs. throughput is a key metric for determining storage efficiency.
This behavior of the scheduler is work-conserving as it does not cause any performance degradation, and provides QoS only when the system has been overprovisioned on performance. As discussed earlier, every storage system has an upper limit on the performance it can deliver. If the user drives more IOs than the system can support, the VMs will start contending for performance resources. Any additional latency experienced by the VM when it is contending for resources is called “contention latency.”
Tintri file system computes the system-wide contention latency as the average time IOs spend in the proportional scheduler before they are admitted into the read/write pipeline. As discussed in previous sections, each VM in the proportional scheduler gets a queue. This allows tracking of per-VM contention latency, by measuring the average time IOs from a VM spends in its VM queue, in the proportional scheduler.
The system level contention latency information can be used by the end-user to determine if the system is currently overloaded (Figure 7). To further troubleshoot the performance-overprovisioning problem, the user should be able to determine which VMs are causing most contention in the system. Tintri is able to provide this troubleshooting tool in form of system level and per-VM contention latency. Figure 8 shows a snippet where a VM was experiencing high contention latency due to characteristics of its workload.
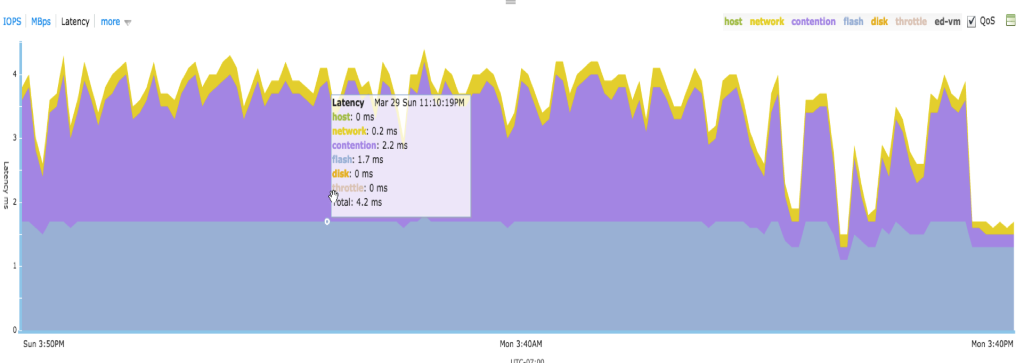
Figure 8. A virtual machine showing high contention latency.
In the majority of cases, fine-tuning QoS settings based on service levels is not needed. However, to handle the small minority of cases where tuning is required, or to provide performance protection with different service levels to different users or applications, Tintri allows users to specify per-VM QoS using minimum and maximum normalized IOPS and to visualize the effect of min/max settings on individual VMs.
We prefer using normalized IOs over the actual IOs measured on a VM, because the former is a more accurate gauge of performance than the latter, as it takes into consideration the request size of IOs.
A normalized IOPS is similar to throughput: IOPS measured at 8KB units. Anything less than a multiple of 8KB is rounded up to 8KB. Examples:
- 4KB => 1 normalized IO
- 8KB => 1 normalized IO
- 12KB => 2 normalized IOs
- 16KB => 2 normalized IOs
The user should not worry about calculating the normalized IOPS on a per-VM basis, as Tintri provides the visualization for the data (see Figure 9). The user should be familiar with the actual IOPS graph, with a read/write split. The graph overlays the normalized IOPS on the top of actual IOPS, so that the user can understand the relationship between actual IOPS and normalized IOPS, in addition to getting familiar with normalized IOPS.
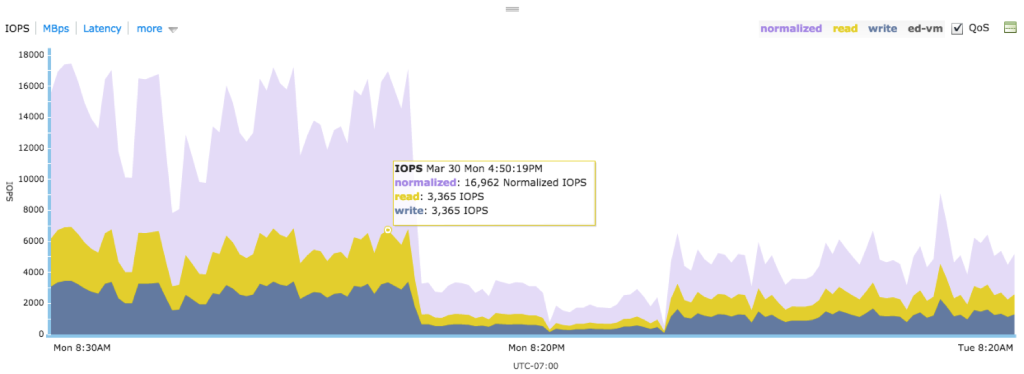
Figure 9. Graphing normalized IOPS.
We leverage the performance isolation infrastructure to implement minimum performance guarantees, for performance protection. The proportional scheduling uses a share assigned to each VM’s queue. For default performance isolation, each VM’s queue has an equal share, thus achieving fair scheduling.
When user increases a minimum performance guarantee (i.e., normalized IOPS) setting on a VM, they identify that VM more important than others. In this case, that VM is assigned a share, which is directly proportional to the minimum normalized IOPS setting on that VM. This allows the system to prioritize this VM over other VMs, and hence achieve defined minimum performance service levels. Users can assign minimum normalized IOPS up to a per-model calibrated number such that they do not cause starvation for other VMs on the system; the performance service level settings are realistic.
If the contention latency on a VM is high and the user thinks that the VM is an important one to their business, a mechanism is provided to reduce that VM’s contention latency.
This can be achieved by increasing minimum IOPS for the VM. Note that Tintri’s storage QoS does not create performance for this VM; it transfers performance resources from a less important VM to a more important VM. This is similar to Law of Conservation of Energy in Physics.
When a maximum normalized IOPS is set on a VM, IOs from that VM may be throttled by the Tintri Storage QoS. If a VM has a maximum normalized IOPS set, IOs from that VM pass through the throttler after they exit the read/write pipeline. This is because IOs have already finished by this time, the exact IO latency for each IO is known. This makes it easy for the throttler to decide if it needs to add latency to the VM’s IO before sending a reply to the client.
The throttler tracks a next service time for every VM and decides if it needs to add an additional latency to a VM’s IO. This additional latency added to VM’s IO is a function of VM’s IO queue-depth, average IO latency on storage without throttling, and max normalized IOPS setting. If an IO is subject to a throttle, it would be added to a throttler queue for the amount of time equal to the throttle latency added for that IO.
Tintri file system computes the per-VM throttle latency by keeping track of the average time the IOs spend in the throttler queues. This latency shows up on VM’s latency chart only when a user sets a maximum setting on the VM and the VM is throttled.
It is hard for the user to predict what latency the VM would experience if they were to set a maximum cap on the VM’s performance. This makes it hard to determine the right number for maximum normalized IOPS. Therefore, Tintri provides a per-VM throttle latency visualization (Figure 10), which helps the user understand the latency impact of setting a maximum normalized IOPS on a VM.
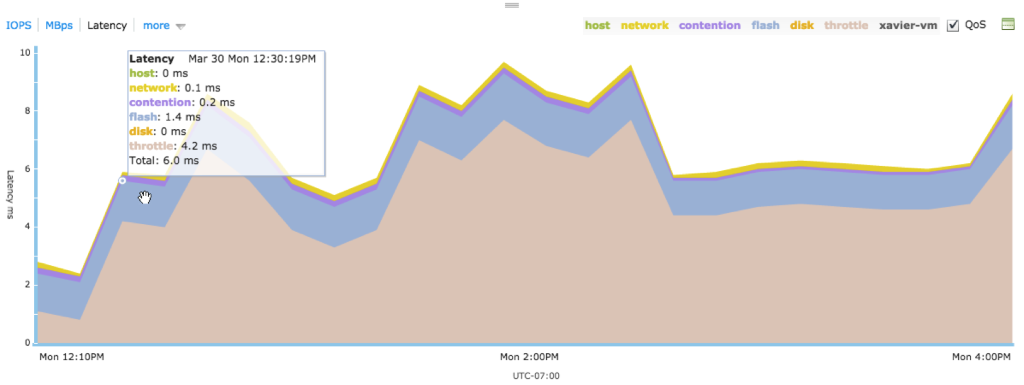
Figure 10. Tintri’s per-VM throttle latency.
So far we have discussed how Tintri solves the per-VM storage QoS problem. In addition to a VMs IO consuming performance resources, any file system can have internal components that can demand their share of performance resources. Tintri file system is no exception, making it important to isolate performance demands for one internal file system subcomponent from other internal file system component or external traffic. Here are some of the common internal file system components that run in background and can consume performance resources:
- GC for log-structured file systems.
- Flash eviction in hybrid file systems, to keep the hot data in flash and evict cold data to disk.
- RAID rebuild, if a SSD or HDD drive fails.
- Read caching in hybrid file system, which involves moves the cold data that has been accessed from HDD into SSDs.
- Per-VM replication for data protection.
Tintri’s Storage QoS considers these internal file system components as internal VMs, and assigns a service level to them. Each of the above components has been calibrated to have a model-specific minimum and maximum.
While configuring per-VM storage QoS, in terms of minimum and maximum normalized IOPS, a user has the flexibility to choose from the following configurations:
- Set both minimum and maximum IOPS for a VM
- Set only minimum and no maximum IOPS for a VM
- Set no minimum and only maximum IOPS for a VM
- Set no minimum and no maximum IOPS for a VM
Tintri provides the flexibility for the user to choose from any of the above. This flexibility results in a heterogeneous QoS configuration, which can be hard to handle. Tintri file system ensures that VMs which do not have any minimum IOPS setting are not starved of resources.
Tintri file system achieves this above goal by carving out system resources into four categories, as shown in the Figure 11.
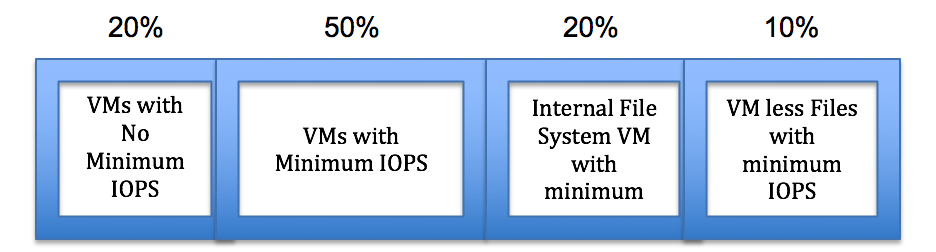
Figure 11. System resource categories.
- VMs with no minimum normalized IOPS set are allocated 20% of system resources. Hence, the default minimum for such VMs can range anywhere from 100 to 1,000, depending upon number of VMs in this category.
- It is recommended to allocate minimum IOPS for VMs from 50% of system resources. This is not a hard limit; just a recommendation.
- All the internal file system VMs are allocated 20% of system resources, so that they get appropriate resources when requested.
- VM less files can also experience IO traffic; the most common reasons are workload provisioning, storage vMotion workload on destination VMstore. This category gets 10% of system resources.
Note: This is not a hard boundary between different categories. VMs in one category can use up performance resources from other categories if they discover that it is available. When there is a lot of contention for resources, each category gets a minimum of what has been allocated to its category.
Thus, Tintri storage QoS understands requirement from different workloads, and isolates them from each other. It also provides an auto allocation of resources when required.
Tintri per-VM storage QoS is native to the Tintri file system and is extremely simple, efficient to use and to troubleshoot because of the following capabilities:
- Leverages the VM-awareness of Tintri Storage Appliance to perform per-VM storage QoS natively. It implements per-VM performance isolation and performance protection. The latter is defined in terms of minimum and maximum normalized IOPS set on a per-VM basis.
- Leverages normalized IOPS as a performance metric to configure per-VM QoS policies, and help with the visualizations of per-VM normalized IOPS in relation to the per-VM actual IOPS.
- Exposes system-level and per-VM contention latency, which helps in troubleshooting storage QoS-related performance problems. It also provides a mechanism to improve performance of a VM with per-VM minimum normalized IOPS configurations.
- Exposes per-VM throttle latency, which aids with per-VM maximum normalized IOPS configuration.
- Provides automatic resource allocation between external VM IO traffic and internal file system workload requirements. It also provides flexible QoS configurations for the end user.
Data Protection and Disaster Recovery
Snapshots and Clones
A popular analogy used to describe a “snapshot” within the realm of information technology is a camera snapshot, which captures an image at the point-in-time when the shutter button is depressed. In our case, the image is not a picture; it is the state of a VM and its constituent files at the moment of the snapshot (Figure 12).
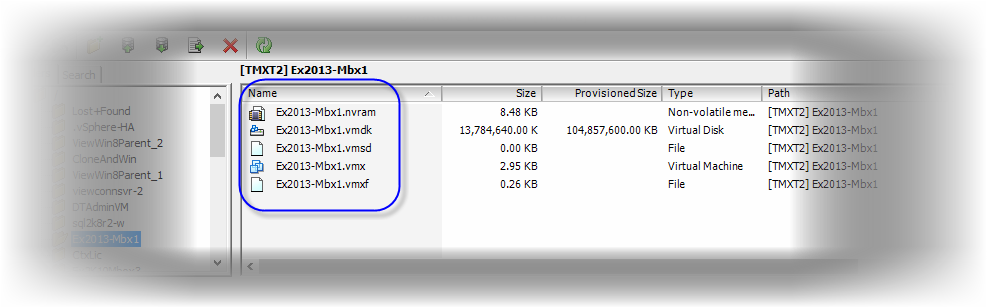
Figure 12. A snapshot of a virtual machine, showing all files.
Creating point-in-time snapshots of VMs provides a versioning of sorts, providing access to a VM and its application data at the exact date and time of a given snapshot (Figure 13).
Snapshots provide a quick way to restore a VM and its application data back to the point-in-time captured by a VM snapshot, and to create new space-efficient VMs, which derive their initial state from a VM snapshot. The rest of this section will detail how snapshots help power server and desktop virtualization, from the deployment of new VMs to fulfilling the data protection and recovery requirements of VMs across data centers.
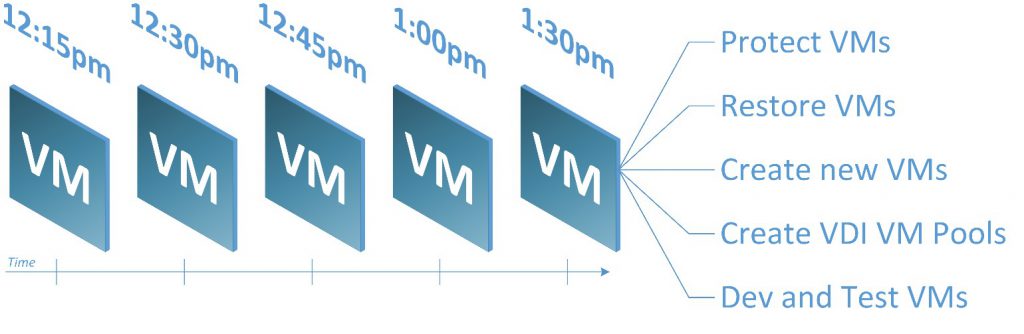
Figure 13. Snapshots taken at 15-minute intervals.
Data lives within file system blocks. Blocks, when linked together by a file system, constitute files. The bigger the file, the more blocks it will take to store all of a file’s data. The files that make up a vSphere VM, such as one or more virtual hard disk files (.vmdk), as well as its configuration files (.vmx) and other files, collectively comprise what we know as an (individual) VM.
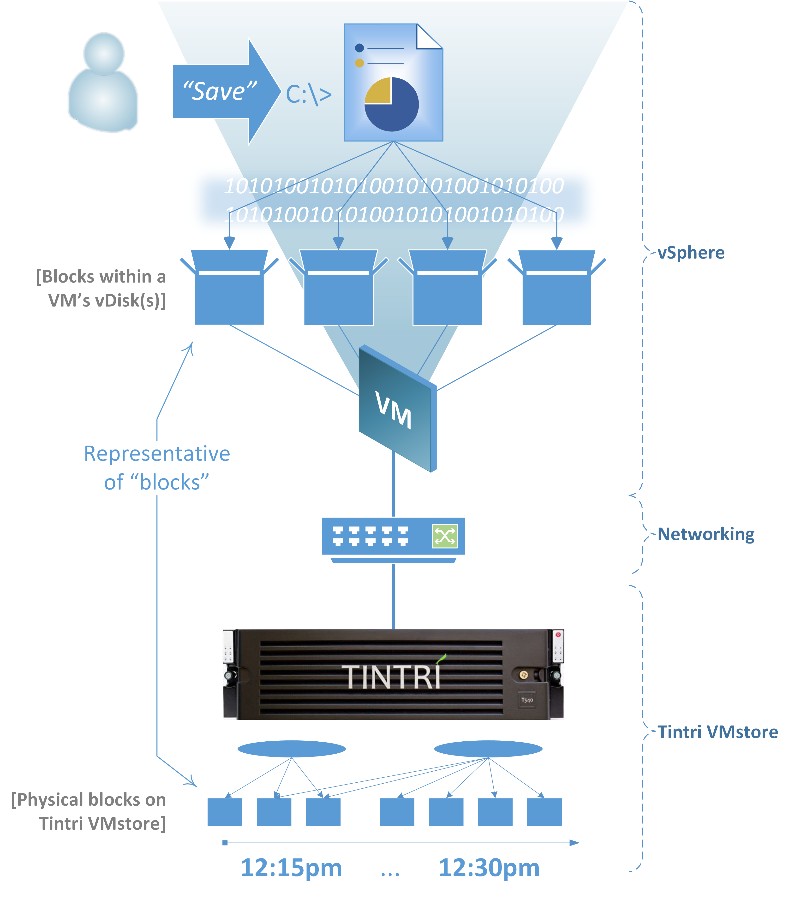
Figure 14. Anatomy of a virtual machine file.
Each block contains data stored within a VM’s files (see Figure 14).
When you save a file, you are instructing an application to save, or persist what you are working on. What actually happens within a VM is that the file’s data is stored in one or more blocks in the VM’s file system. Since we are talking about a virtual machine, the blocks in this case are stored in the VM’s virtual hard disk files, or “vDisks” (e.g. .vmdk files). Those vDisks live on Tintri VMstore. Therefore, when saving changes to a file, the writes are to a VM’s vDisk(s), which exist on Tintri VMstore.
Tintri VMstore keeps track of the changes to all of its VMs’ vDisks within its flash-based file system, and preserves them in snapshots according to an administrator’s operations and configured snapshot schedules.
Consider the following scenario using an assumed VM named “Win8-VM1”
- The first snapshot of Win8-VM1 is created at 12:15pm
- The next snapshot is created fifteen minutes later, at 12:30pm
In Figure 15, note that the snapshots named “Snap-1” and “Snap-2” both have pointers to Block2 and Block3.
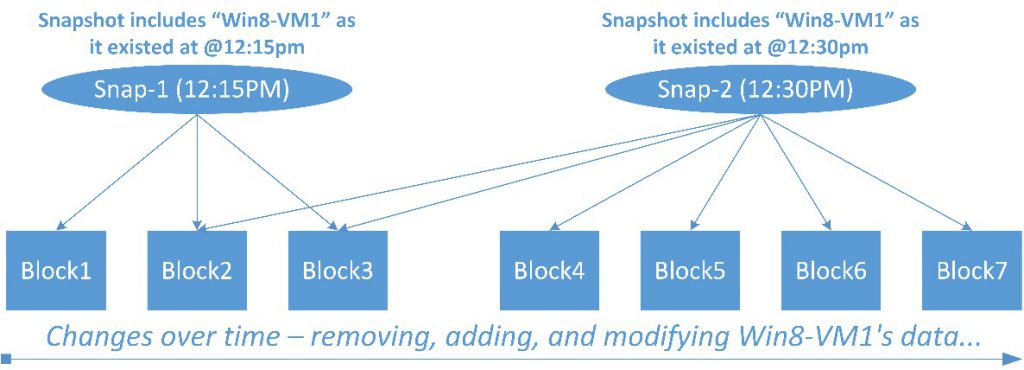
Figure 15. Snapshot creation.
When creating Snap-2, it would be inefficient to make additional copies of Block 2 and Block3 just to include them in Snap-2. Instead, Snap-2, like Snap-1, records pointers to the locations of the existing blocks 2 and 3.
A small example: Imagine that sometime between Snap-1 and Snap-2, at 12:20pm, that you open a spreadsheet, replace a cell value, and then save those changes. The old cell value is in Block1, safely protected by Snap-1. Assume that when you save the spreadsheet, the new cellvalue lands in Block4.
By design, it is not possible to modify a block referenced by snapshots. Block1 is protected by the Tintri file system from overwrites or deletion, as long as any VM or snapshot has a reference to it. Only when a given block’s reference count drops to zero (i.e., no VM or snapshots “point to it”) will Block-1’s location be marked as “free,” allowing new writes to it.
Notice in Figure 4 that Snap-2 does not include a pointer to Block1. This is because writes always occur to new blocks, as opposed to returning to Block1 to modify its data. This technique accelerates IO operations and allows the Tintri file system to quickly record pointers to snapshotted blocks. In addition, the old value (stored in Block1) is not germane to Snap-2. Consequently, Snap-2 does not record a reference to Block1. The prior version of the VM and its spreadsheet as captured at 12:15pm will remain available through Snap-1.
To create a snapshot of a VM, all of its files are collectively snapped at the same point in time, as quickly and as efficiently as possible.
There are two common ways to approach the creation of snapshots for VMs:
- Crash-consistent: Create a snapshot of the VM without taking extra measures to coordinate the snapshot with the VM’s guest operating system and its
- VM-consistent: Create a snapshot while also taking further steps to coordinate the construction of the snapshot with the hypervisor (e.g., vSphere ESX/ESXi), and the guest operating system and its
While both crash-consistent and VM-consistent snapshots can be equally utilized by an administrator, the VM state captured within a crash-consistent snapshot is considered “unknown.” That does not mean it is inaccurate or unusable, just that the VM’s condition was captured on-the-fly.
When a VM is actively performing work, one of its applications may have data in-flight, i.e., not yet written to its vDisk(s), at various points in time. VM-consistent snapshots utilize software within a VM’s guest operating system to synchronize a flush of application data writes from the VM’s memory to its vDisk(s) when creating a VM-consistent snapshot. Consequently, the VM commits any volatile data residing within its memory to its vDisk(s) and, therefore, the VM snapshot. Hence the term “VM-consistent.”
In vSphere environments, VMware Tools installed within each VM’s guest operating system allow the hypervisor to “reach into a VM:” to interact with specific aspects of the VM’s guest operating system, such as the freeze/thaw operations associated with Microsoft Volume Shadow Copy Services (VSS) for Windows. VM-consistent operations with pre-defined scripts are also part of VMware Tools for Linux guest VMs.
There are also other application-specific VSS components for Microsoft Exchange, Microsoft SQL Server, and many others, which provide specialized functionality and extended integration capabilities with various third-party tools. Those components work together with VMware Tools to facilitate backups and data protection, data management operations, etc. While the applications vary, application-specific components play a pivotal role in the VM-consistent snapshots required for advanced database and server VMs.
Storage hardware-accelerated snapshot functionality was available long before virtualization was a mainstream technology.
Hardware-based snapshots were immediately applied to virtualization by storage vendors to help overcome the performance limitations of software-based snapshots. However, while the seemingly universal adaptability of legacy hardware snapshots is significant, so also are the entanglements and limitations of their bonds with their respective storage technologies.
Fundamentally, the design of general-purpose shared storage and SAN systems serves bare metal — or physical — servers and PCs (see Figure 16).
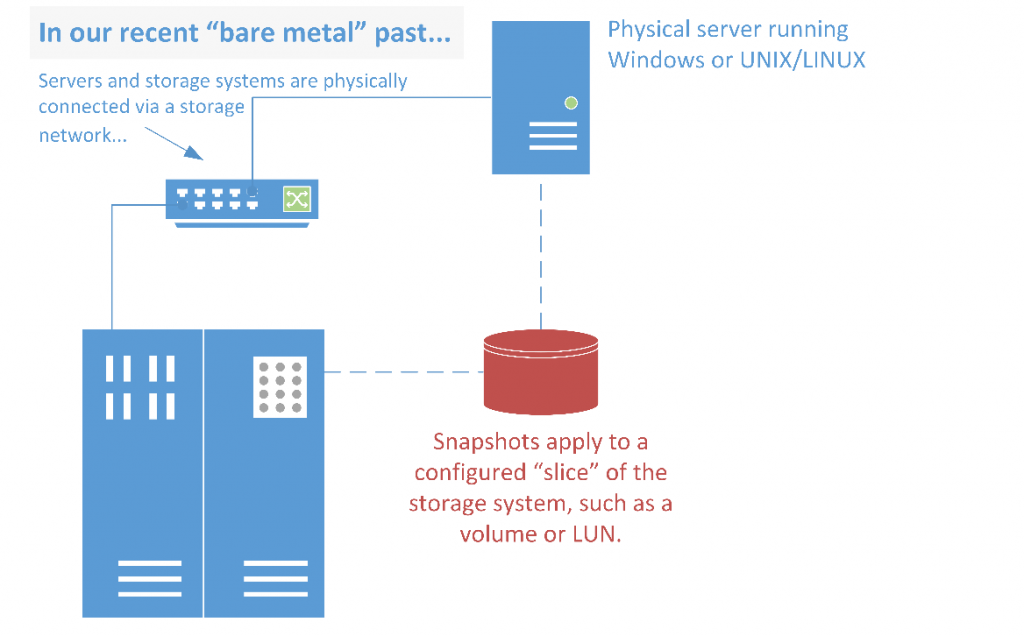
Figure 16. Snapshots with “bare metal” physical servers, before virtualization.
Prior to virtualization, hardware snapshots worked well with physical servers and their applications. Snapshots accelerated the rate at which servers and their application data could be snapped for quick recovery operations.
Hypervisor server software runs on “bare metal:” on the physical server hardware. This paper focuses on vSphere.
With traditionally structured shared storage and modern versions of ESXi, you can provision larger datastores using SAN technologies than ever before due to improvements in VMFS. The tradeoff is that when it comes to hardware-accelerated snapshots using LUNs as datastores, you must create a snapshot of the entire datastore and all of the VMs contained within a given datastore.
There are two choices when provisioning:
- Provision a large number of datastores, one for each VM (via storage system operations) so that you can target individual VMs for snapshots (more specifically, target their containing datastores).
- Place several VMs in fewer datastores to simplify management, sacrificing the ability for “per-VM” snapshot fidelity.
It is a best practice to limit the VMs or vDisks per LUN in SAN environments, due to factors such as per-LUN or target queue depths, protocols, switch fabrics, etc. The impositions associated with these storage-related factors dictates VM and application management. This class of constraints is becoming increasingly outdated.
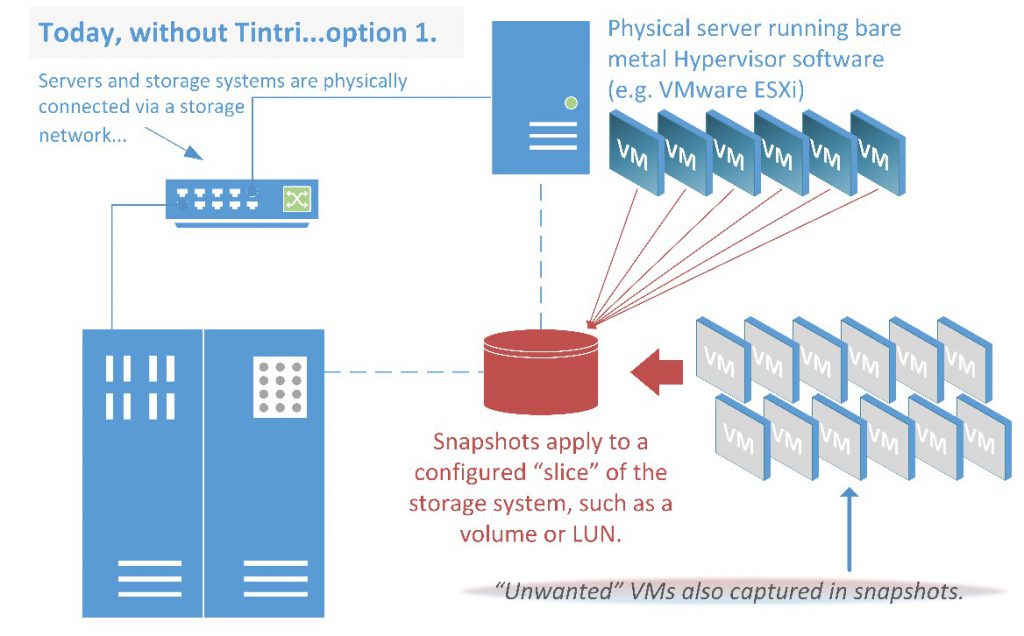
Figure 17. The problems of snapshots at the hardware level.
A snapshot of a LUN or volume captures all of its VMs, irrespective of which VM or VMs are of interest, as shown in Figures 17 and 18. Snapshots are of the LUNs, volumes, or other storage system units, not of the individual VMs. Consequently, complex storage configurations are unavoidable when using traditionally structured, shared storage.
The paradigm shift from bare metal to virtualization has overstretched legacy storage technologies. Newly-marketed flash-based products, which have followed in the footsteps of traditional shared storage designs, embody these same limitations.
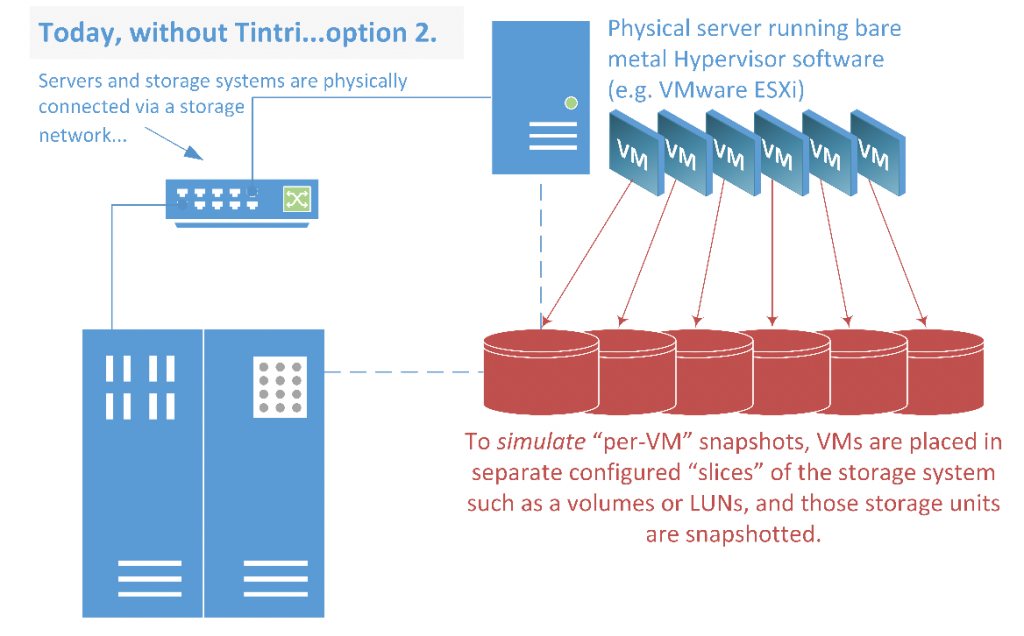
Figure 18. Another way to do snapshots, again showing the limitations of the method.
To meet your criteria for creating snapshots of an individual VM when using traditionally structured storage, you must first configure the storage to match the way you want to manage the VMs. Then, you must forcibly locate the VMs accordingly. The unavoidable rigidity of traditionally structured storage conflicts with the software-defined data center and creates undue pressure on storage and virtualization managers by severely limiting the agility and resource utilization benefits intrinsic to virtualization.
The coupling of snapshot implementations to the internal structures of traditional storage designs creates a circular dependency, in which VM deployments must meet complex, vendor-specific storage placement requirements in order to have their own operational requirements satisfied.
Since these storage architectures do not intrinsically recognize a VM, cannot interact with a VM, and are only capable of creating snapshots of the storage provisions where administrators locate their VMs, they are outdated and poorly adapted to the virtualization experience, forcing virtualization deployments into the bare metal methodologies of the last two decades.
Tintri VMstore has the advantage of being purpose-built from the ground up for flash (SSD) and virtualization by pioneers in storage and virtualization. Each Tintri VMstore is a single datastore with individual, per-VM capabilities woven into its deepest depths and features. This innovative approach leapfrogs traditional storage vendors, which must develop, promote, and support bolt-on software and plugins in an effort to reduce the gaps between virtualization and their storage platforms and snapshots.
Asynchronous Replication
Introduced with TintriOS release 2.0, Tintri ReplicateVM extends the snapshot and cloning capabilities of Tintri VMstore to appliances in a single data center or across multiple data centers.
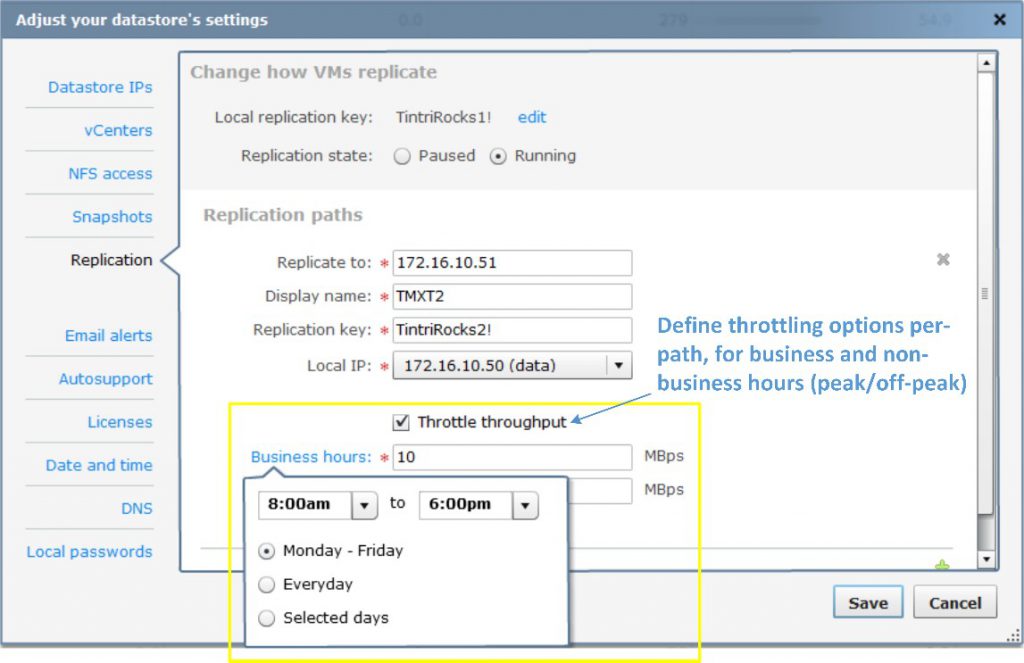
Figure 19. Pointing to the VMstore for the replication path.
Like cloning, ReplicateVM also uses the point-in-time snapshots of a given VM as the measure of replication. For example, a snapshot schedule that creates snapshots every 15 minutes determines what is replicated every 15 minutes. Therefore, for a VM protected with replication, the snapshot schedule and the replication schedule are one and the same.
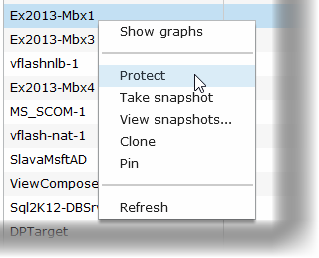
Figure 20. Preparing to snapshot the virtual machine.
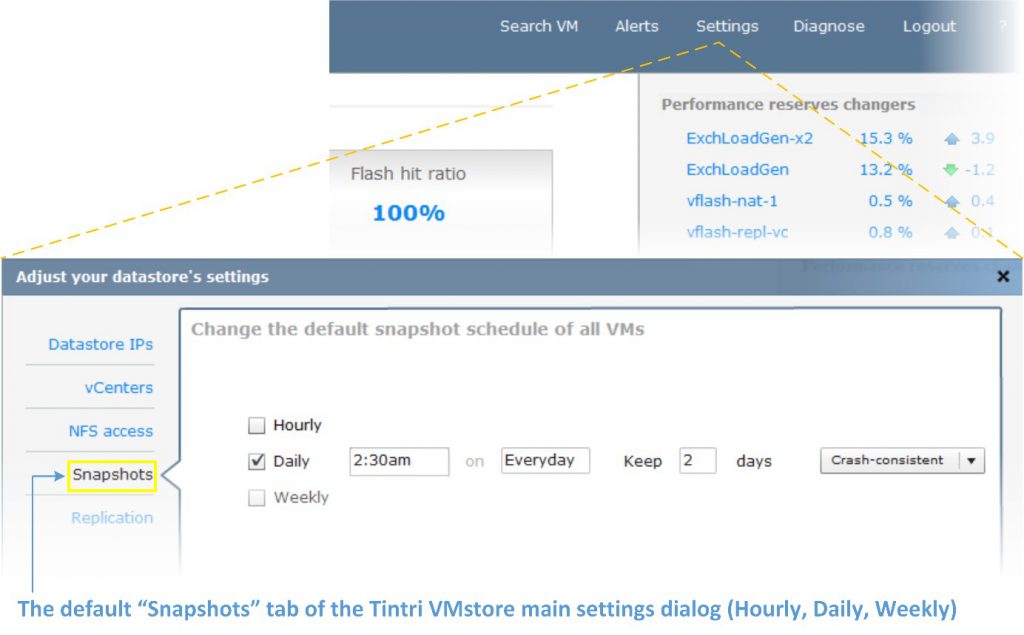
Figure 21. Setting snapshot schedules.
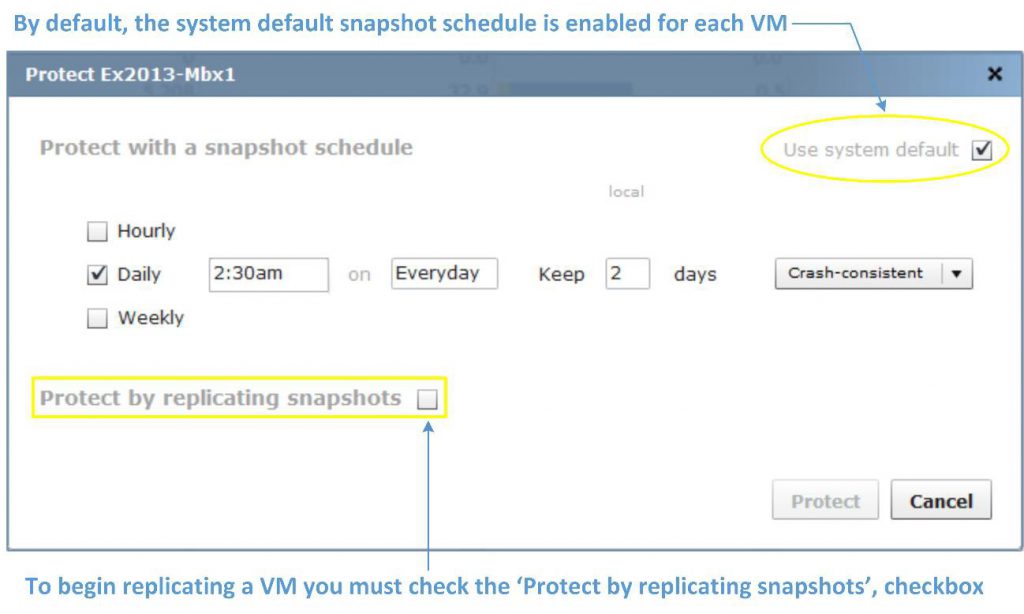
Figure 22. Replicating snapshots.
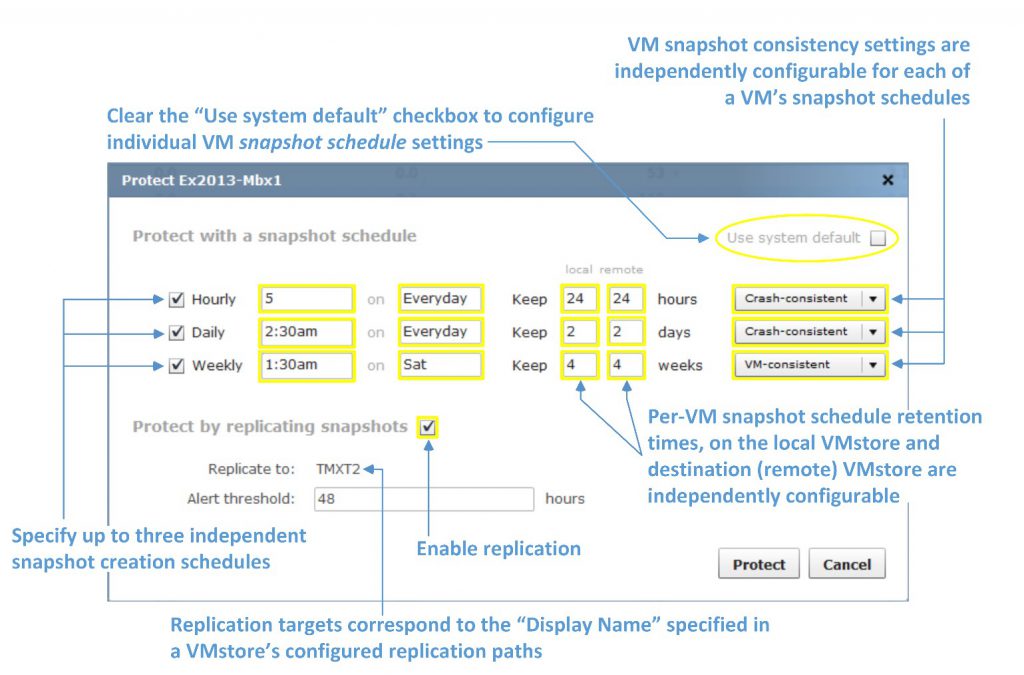
Figure 23. Many options are available for snapshot replication.
Tintri VMstore currently supports 16 paths per system. Setting up replication paths between Tintri VMstore systems is straightforward. On each Tintri VMstore:
- Specify the network path to your destination Tintri VMstore (Figure 19)
- Right-click on each VM and select the “Protect” (snapshot scheduling) options for a VM (Figure 20)
- Specify up to 3 snapshot schedules for each individual VM (Figure 21)
- Check the “Protect by replicating snapshots” checkbox (Figures 22, 23)
In addition to specifying the host name and IP address for a path, Tintri VMstore requires administratively-defined replication keys when setting up paths. You can create and use more cryptic looking keys, but entering keys that are easier to remember and type are easier. Each administrator will decide what works best for their organization.
In addition to specifying the local and destination network paths between Tintri VMstore devices, ReplicateVM path specifications include options to throttle, or limit the maximum amount of snapshot data transferred in megabytes-per-second (MBps), over each defined path.
Throttling throughput allows administrators to regulate and predictably manage the bandwidth utilization used by replication during business and non-business hours. This is particularly beneficial when replicating data over fixed wide-area network (WAN) leased lines between data centers in different locations, and in different time zones.
The system default snapshot schedule does not determine per-VM replication with ReplicateVM. However, when you select a VM for replication, you can “inherit” or use the system default snapshot schedule (Figure 21) for replication, or create an individual schedule for each VM (Figure 22).
To configure a default schedule for all VMs on the system, click the “Settings” menu on Tintri VMstore, and then select the “Snapshots” tab (Figure 21).
Configuring per-VM replication is a matter of selecting a VM and instructing Tintri VMstore to protect it by creating snapshots of the VM according to the desired (hourly, daily, weekly) snapshot schedules, and then replicating those snapshots to a destination Tintri VMstore.
The “Protect” menu opens the protection settings for the selected VM. Note in Figure 22 that the “Use system default” checkbox is initially “checked,” and the schedule matches the system default schedule.
Once a given VM is protected, and the “Protect by replicating snapshots” option is checked, Tintri VMstore will begin transporting a VM’s individual deduplicated and compressed snapshots.
Each VM is configurable with its own snapshot and replication settings. Figure 23 describes the additional options available for each individual VM when you clear the “Use system default” checkbox.
The options in Figure 23 are applicable to any VM on Tintri VMstore. Notably absent references to arcane and complex storage-related tasks are not omissions. Tintri VMstore keeps the focus on the VMs and their applications and services.
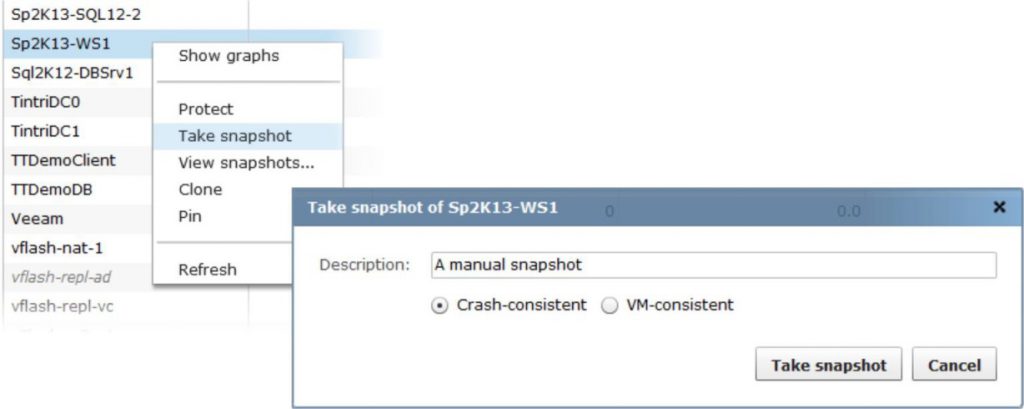
Figure 24. Taking a manual snapshot of a virtual machine.
New snapshots trigger ReplicateVM updates. Therefore, a snapshot created via one of Tintri VMstore’s per-VM schedules, or because of an administrative action (Figure 24), will initiate a ReplicateVM update to a VM’s destination VMstore.
For a VM protected by snapshots and ReplicateVM, each replication update is deduplicated and compressed, to provide optimal performance and fast VMstore-to-VMstore transfer times with maximum network efficiency.
Known for its intuitive UI and integrated per-VM graphing capabilities, Tintri VMstore adds new monitoring and graphs for ReplicateVM that allow administrators to monitor replication performance on a per-VM basis.
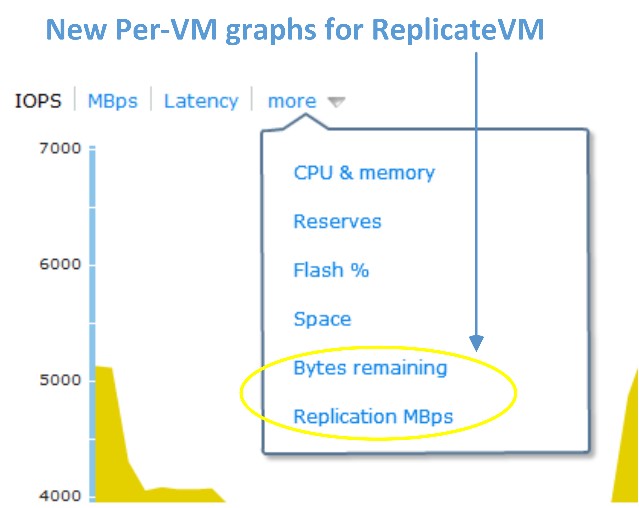
Figure 25. A ReplicateVM graph, accessed via a virtual machine’s dropdown.
A VM’s ReplicateVM graphs can be accessed easily from the Tintri UI by selecting the “more” dropdown list for the VM (Figure 25). ReplicateVM graphs are viewable on both the originating (source) and remote (destination) Tintri VMstore systems for each VM. The progress and throughput of a VM, as well as its overall replication status, is clearly visible and easy to see at-a-glance.
In Figure 26, the logical throughput represents the full size of the data if it were not deduplicated and compressed. The network throughout is the actual amount of data (measured in MBps) being actively transferred. Deduplication and compression are natural attributes of ReplicateVM.
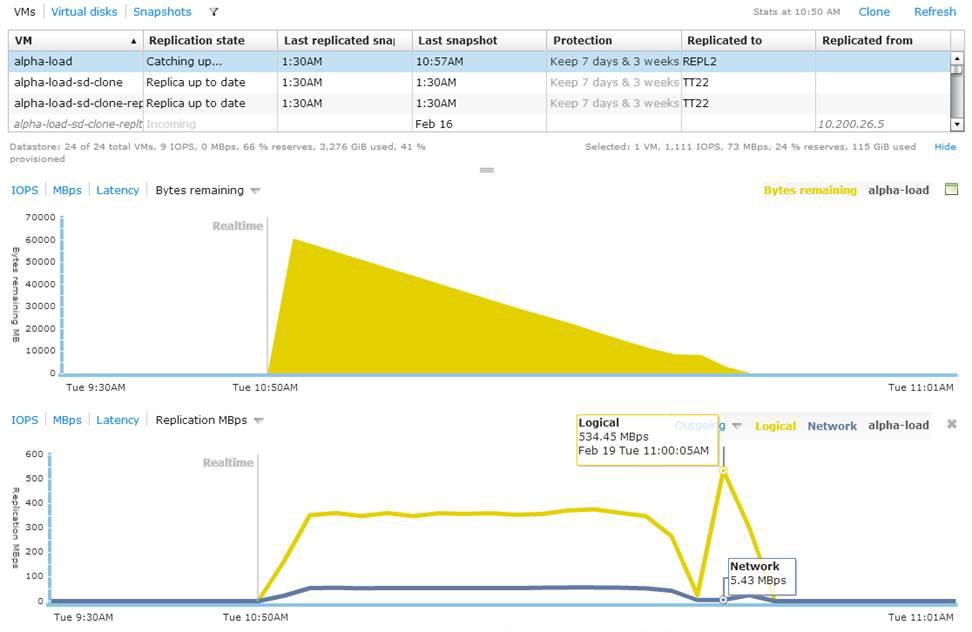
Figure 26. Data size of a virtual machine before deduplication and compression.
Tip: Remember that for each path configured between your Tintri VMstore appliances, configurable throttle values determine the upper limit or replication throughput ceiling (measured in MBps) for a given path during peak and non-peak business hours.
In addition to the cloning options mentioned in the “VM Cloning with Tintri VMstore” section of this paper, ReplicateVM extends the cloning power of Tintri VMstore and provides an array of new and flexible options:
- You can replicate VMs from Tintri VMstore to VMstore in one-to-one, and many-to-one topologies, bi-directionally (in both directions)
- Cloning for restore or deployment operations, is supported locally (on the originating end of VM’s replication path), and remotely (on the destination VMstore), to which a VM’s snapshots are being replicated (i.e., via remote cloning)
For VMs protected by ReplicateVM, remote cloning (Figure 27) allows an administrator to create new VMs from snapshots on the remote or destination end of a ReplicateVM configuration. On the remote VMstore, the virtualization administrator simply browses the Tintri VMstore using the datastore browser in the vSphere client for example, and then adds the new VM to vCenter inventory. Remote cloning is a powerful remote management feature with many possible applications.
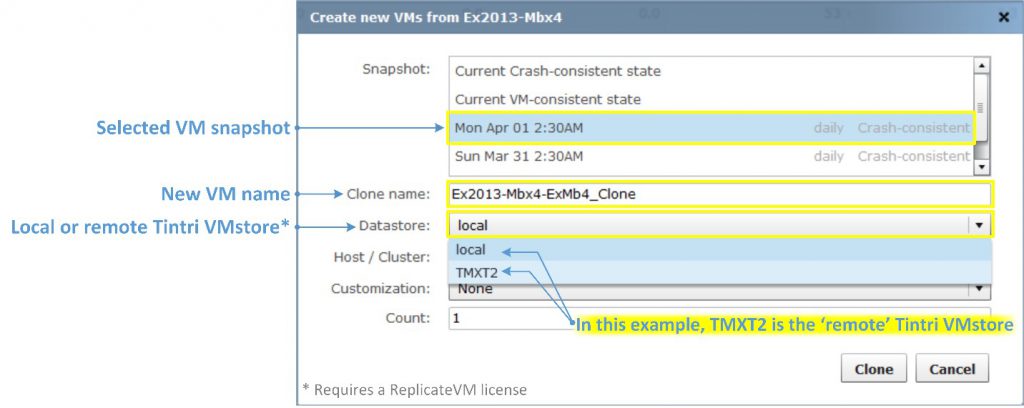
Figure 27. Remote cloning is powerful.
ReplicateVM can be incredibly useful for many applications. The list below is a sample of the applications used by Tintri customers, including applications tested and supported by Tintri VMstore with ReplicateVM.
- VMware Horizon View (VDI)
- Citrix XenDesktop (VDI)
- Microsoft SQL Server 2005 (including database mirroring for HA)
- Microsoft SQL Server 2008/R2 (including database mirroring for HA)
- Microsoft SQL Server 2012 (including Always On Availability Groups for HA)
- Microsoft Exchange Server 2010 (including Database Availability Groups for HA)
- Microsoft Exchange Server 2013 (including Database Availability Groups for HA)
- SAP on Unix and Windows
- Engineering and Geo-physical applications
- Test, Development and QA
- Transactional Financial Applications
- Private Cloud and Hosting Provider implementations
- Business Intelligence and Reporting Applications
ReplicateVM is particularly powerful when it comes to replicating important, mission-critical data sets and assets essential to the operations of an organization. This includes, but is not limited to, protecting the core VM and application images used in server and desktop virtualization environments, and replicating the snapshots of those applications and images across multiple systems in geographically dispersed data centers.
Advantages of Per-VM Snapshots
For the purposes of this document, assume that software-based snapshots are implemented by a hypervisor server, such as vSphere ESXi.
Hardware-based snapshots are features implemented in storage systems with capabilities that extend beyond the basic functionality of Direct Attached Storage (DAS) or “Just a Bunch of Disks” (JBOD) storage.
Software-based snapshots such as vSphere’s native snapshots are typically free and exceedingly easy to use. Software snapshots are also VM-specific.
VMware vSphere ESX/ESXi snapshots implement a series of related virtual hard disk files, or “snapshot chains,” to manage and track a VM’s snapshots. Unfortunately, the practical applications of software snapshots are limited due to the extraordinary and widespread IO activity associated with a VM’s disk chain. The penalties even on fast (i.e. flash/SSD) drives can be serious and costly, given the amount of flash/SSD storage space consumed by the disk chain’s snapshot files.
VMware’s best practices recommend no more than three (software) snapshots at a time for a VM, and you should avoid using and retaining them past 24-72 hours to avoid significant performance complications.
The common attribute that all storage-based snapshots share is that they allow hypervisor host servers to delegate the heavy lifting of creating and managing the snapshots to the storage, freeing host server resources.
While hardware-based snapshots are much faster than software-based snapshots, they are not necessarily easier to use. Traditionally structured shared storage systems, even those that employ flash/SDD drives, can simulate “per-VM” snapshots with specialized software or plugins. Unfortunately, the deployment and management complexities, and the limitations of the underlying hardware, are unavoidable.
Tintri VMstore is the only storage appliance that actually creates snapshots of VMs, rather than creating snapshots of arbitrary storage configurations where a VM’s files happen to be located. There is a stark contrast between these two approaches. The entire lifecycle, from the acquisition and deployment costs, to the manageability and TCO of a virtualization storage platform, necessitates a solid understanding of how these choices affect your organization.
SRM Integration for Comprehensive DR
VMware vCenter Site Recovery Manager (SRM) is a DR solution that provides automated orchestration and non-disruptive testing of centralized recovery plans for all virtualized applications (see more at: https://www.vmware.com/products/site-recovery-manager.)
SRM 5.8 brings additional enhancements for managing DR workflows. The most visible change is that SRM 5.8 is fully integrated as a plug-in with the vSphere Web Client. In addition to not having to use two different interfaces to manage virtual environments, improvements were also made to a few workflows, making it easier and simpler to map arrays, networks, folders, etc. without manual intervention.
This section will walk you through the process of setting up SRM 5.8 on Tintri VMstore 3.1 and provide best practice guidelines to implement a DR solution that is as unobtrusive as possible in day to day (normal) operations, but still provides the RPO (Recovery Point Objective) and RTO (Recovery Time Objective) needed for your business.
This document assumes you are working with a fully configured virtual infrastructure. It also assumes that, in case you are leveraging Microsoft Active Directory (AD) for authentication and policy management and enforcement, that there already is a non-SRM-based AD DR plan in place (i.e., leveraging AD’s native replication) as per Microsoft Best Practices. AD should not be replicated using storage replication technology, as it could potentially cause a USN rollback scenario.
Using VMware SRM with Tintri VMstore
VMware Site Recovery Manager (SRM), combined with Tintri VMstore, shields users from having to manage many of the steps required for traditional recovery. Tintri ReplicateVM provides the ability to configure replication at the VM level (see Figure 28).
Setting up a recovery plan can be done in a matter of minutes, instead of weeks. Ongoing DR provisioning to new VMs can be driven through predefined policies. Actual execution of testing, recovery and migration workflows is fully automated, to eliminate operational complexity.
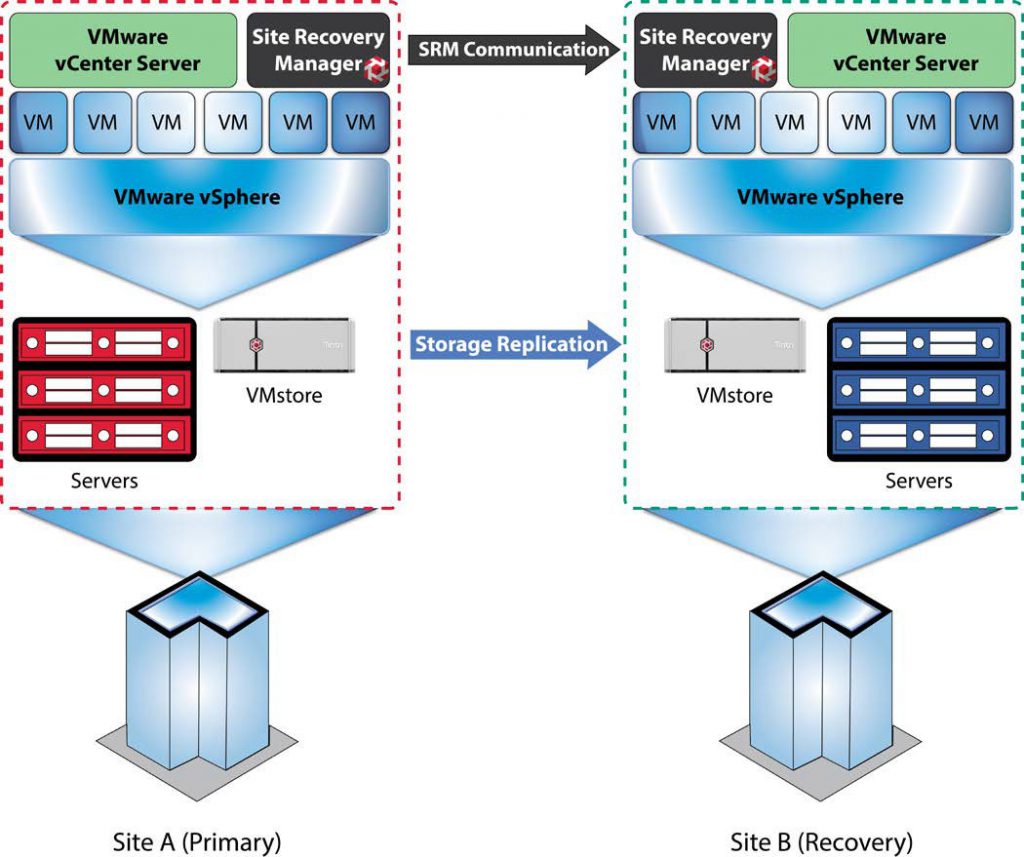
Figure 28. Architectural overview of VMware’s Site Recovery Manager and Tintri VMstore replication for disaster recovery.
Tintri ReplicateVM provides extremely WAN-efficient array-based replication between Tintri VMstores. Tintri’s Storage Replication Adapter (SRA) leverages the easy management and WAN-efficient replication capabilities of Tintri OS to provide SRM-integrated DR workflows, resulting in an extraordinarily simple and quick setup, followed by minimal replication traffic between VMstores. This saves bandwidth and time, lowering TCO. The performance impact on each VMstore is also minimal, enabling an unobtrusive DR strategy with incredibly low TCO.
The list below includes the recommended best practices in this document. For additional information, click the text on any of the recommendations to jump to the section that corresponds to each recommendation.
DO: Use a Microsoft SQL Server database when deploying SRM, rather than an embedded PostgreSQL database.
DO: Install the same version of SRM Server and vCenter Server on both sites (protected and recovery).
DON’T: Use a Tintri VMstore as a placeholder datastore. Use either local hard drives or non-Tintri shared storage.
DO: Make sure you have a ReplicateVM license for your Tintri VMstores.
DO: Try VM-consistent first in a test environment, with copies of the production applications, and testing if the impact is acceptable or not.
DO: Create a Service Group for each SRM Array Manager Pair – i.e., the pair of Protected and Recovery VMstores – that you plan on creating in SRM. There is a 1:1 mapping between Tintri Service Groups and SRM Array Manager Pairs.
DON’T: Try and add a pair of array managers before you create the corresponding Service Group in the primary’s VMstore. The array manager pair creation in SRM will fail if there isn’t a corresponding Service Group already created via the Tintri GUI.
DON’T Run a Recovery Plan for testing; use the Test Recovery Plan feature for testing.
SRM is supported by any edition of vSphere, except vSphere Essentials.
vSphere licenses are required for all servers on which vSphere is installed, whether that host is at a protected site or a recovery site, and whether a server is running or powered down at the recovery site. SRM requires at least one licensed vSphere server at both the protected site and the recovery site.
SRM is supported with vCenter Server for Essentials, vCenter Server Foundation and vCenter Server Standard.
SRM requires two active and licensed vCenter Server instances, one at each site (protected and recovery).
Note: The shared recovery sites feature in SRM enables multiple protected sites with multiple vCenter Server instances to be recovered at a site with a single vCenter Server instance. (The multiple instances of SRM running at the shared recovery site are registered with the same single instance of vCenter Server at the shared recovery site, so you do not need multiple vCenter Server instances at the shared recovery site).
The latest version of SRM can be purchased either as a standalone product or as part of VMware vCloud Suite Enterprise Edition. As a standalone product, SRM is available in two editions, Standard and Enterprise, which can only be purchased on a “per -VM” licensing model. SRM Enterprise edition can also be purchased as part of vCloud Suite Enterprise edition. In this case, SRM is purchased on a “per -processor” licensing model.
SRM Enterprise provides enterprise-level protection to all virtualized applications with no licensing restriction on the number of VMs that can be protected. SRM Standard is designed for smaller environments and limited to 75 protected VMs per physical site and per SRM instance.
Only VMs protected by SRM require SRM licensing. There are two scenarios to consider:
- Uni-directional protection. SRM is configured only to fail over VMs from site A to the site B. In this case, licenses are required only for the protected VMs at protected site A.
- Bi-directional SRM is configured to fail over VMs from site A to site B at the same time that it is configured to fail over to a different set of VMs from site B to site A. In this case, SRM licenses must be purchased for the protected VMs at both sites. Licenses are required for all protected VMs, even if they are powered off.
To fail back from site B to site A (after failover from site A to site B), SRM licenses are required for the “re-protected” VMs at site B. The “per -VM” licenses originally used at site A can be used at site B for this purpose, as long as the licenses are no longer in use at site A.
If SRM is being licensed “per processor” through the vCloud Suite Enterprise at site A, and VMs are failed over to a site B that originally licensed with vSphere only, the vCloud Suite licenses can be transferred to site B in order to “re-protect” and fail back the VMs.
Refer to VMware vCenter SRM 5.8 FAQ for more information.
You must install a SRM Server instance at the protected site and also at the recovery site.
Furthermore, it is recommended that you use (and license) a Microsoft SQL Server database, rather than the embedded PostgreSQL database. SRM 5.8 supports SQL Server 2005, 2008, 2012 and 2014 in almost all its incarnations (including Express, Standard and Enterprise, 32-bit and 64-bit). Check http://partnerweb.vmware.com/comp_guide2/sim/interop_matrix.php for details.
SRM Server can run on the same Windows host operating systems as vCenter Server. For SRM Server 5.8 and vCenter Server 5.5 U2, that includes Windows Server 2008, Windows Server 2008 R2, Windows Server 2012 and Windows Server 2012 R2.
You must install the same version of SRM Server and vCenter Server on both sites. You cannot mix SRM or vCenter Server versions across sites.
For environments with a small number of VMs, you can run SRM Server and vCenter Server on the same system. For environments that approach the maximum limits of Site Recovery Manager (as per http://kb.vmware.com/kb/2081158) and vCenter Server, install SRM Server on a system different from the system on which vCenter Server is installed. If SRM Server and vCenter Server are installed on the same system, administrative tasks might become more difficult to perform in large environments.
If you are using the vCenter Appliance, you will need to install your SRM Servers in a different system than vCenter.
Therefore, at a minimum you will need two Windows 2008/2012 server licenses (one for each site, each running SRM Server and SQL Server and potentially vCenter if no appliance is being used and the environment is small enough), but you may need as many as six, if you install vCenter, SRM and SQL in separate servers in each site.
SRM support is included with the ReplicateVM license. VMstore systems deployed at both the protected site and at the recovery site must be licensed for ReplicateVM.
The system on which you install vCenter SRM must meet specific (virtual) hardware requirements, as shown in Figure 29.
Requirements for Installing SRM
| Component | Requirement |
|---|---|
| Processor | 2.0GHz or higher Intel or AMD x86 processor |
| Memory | 2 GB minimum. You might require more memory if you use the embedded database as the content of the database grows. |
| Disk Storage | 5 GB minimum. If you install Site Recovery Manager on a different drive than the C: drive the Site Recovery Manager installer still requires at least 1 GB of free space on the C: drive. This space is required for extracting and caching the installation package. You might require more disk storage if you use the embedded database as the content of the database grows. |
| Networking | 1 Gigabit recommended for communication between Site Recovery Manager sites. Use a trusted network for the management of ESXi hosts. |
Figure 29. Requirements for installing Site Recovery Manager.
For information about supported platforms and databases, see the Compatibility Matrixes for vCenter SRM 5.8 at Compatibility Matrixes for vCenter Site Recovery Manager 5.8.
SRM Server instances use several network ports to communicate with each other, with client plug-ins, and with vCenter Server. If any of these ports are in use by other applications or are blocked on your network, you must reconfigure SRM to use different ports.
SRM uses default network ports for intra-site communication between hosts at a single site, and inter-site communication between hosts at the protected and recovery sites. You can change these defaults when you install SRM. Beyond these standard ports, you must also (continue to) meet the VMstore’s network requirements.
You can change the network ports from the defaults when you first install SRM. You cannot change the network ports after you have installed SRM.
For a list of all the ports that must be open for SRM, see http://kb.vmware.com/kb/2081159.
For a refresher on the list of all the ports that must be open for the Tintri VMstore, please consult the Tintri VMstore System Administration Manual.
For the list of default ports that all VMware products use, see http://kb.vmware.com/kb/1012382.
Each SRM server can support a certain number of protected VMs, protection groups, datastore groups, recovery plans, and concurrent recoveries.
For details about the operational limits of SRM 5.8 see http://kb.vmware.com/kb/2081158.
For reliability, performance and scalability, it’s strongly recommended to use a Microsoft SQL Server (2005/2008/2012/2014) database instead of the built-in PostgreSQL database. When you create a Microsoft SQL Server database, you must configure it correctly to support SRM.
This section provides the requirements for a SQL Server database for use with SRM. Consult the SQL Server documentation for specific instructions on creating a SQL Server database.
- Database user account:
- If you use Integrated Windows Authentication to connect to SQL Server, and SQL Server runs on the same machine as SRM Server, use the local service account (that has administrative privileges on the SRM Server machine). Use the same account when you install SRM Server. When the SRM installer detects an SQL Server data source name (DSN) that uses Integrated Windows Authentication, it configures SRM Server to run under the same account used for the installer, to guarantee that SRM can connect to the database.
- If you use Integrated Windows Authentication to connect to SQL Server and SQL Server runs on a different machine from SRM Server, use a domain account with administrative privileges on the SRM Server machine. Use the same account, or an account with the same privileges, when you install SRM Server. When the SRM installer detects an SQL Server data source name (DSN) that uses Integrated Windows Authentication, it configures SRM Server to run under the same account used for the installer, to guarantee that SRM can connect to the database.
- Note: this doesn’t always work flawlessly due to problems in the SRM Installer. If it fails, it will do so late in the install with a “retry / fail and back out” error message. If it does so, you can work around the issue by going to the SRM service configuration, changing it to be the correct user (it will incorrectly have set it to local service), and then start the service and hit retry. It should then succeed.
- If you use SQL authentication, you can run the SRM service under the Windows Local System account, even if SQL Server is running on a different machine to SRM Server. The SRM installer configures the SRM service to run under the Windows Local System account by default.
- Make sure that the SRM database user account has the “administer bulk operations”, “connect”, and “create table”
- Database schema:
- The SRM database schema must have the same name as the database user account.
- The SRM database user must be the owner of the SRM database schema.
- The SRM database schema must be the default schema for the SRM database user.
- The SRM database must be the default database for all SQL connections that SRM makes. You can set the default database either in the user account configuration in SQL Server or in the DSN.
- Map the database user account to the database login.
SRM can also support Oracle Server instead of Microsoft SQL Server. Specifically, Oracle 11g Release 2 and 12C are supported. Note, however, that Oracle was not tested during the writing of this best practices guide (only SQL Server was tested). When you create an Oracle Server database, you must configure it correctly to support SRM.
Create and configure an Oracle Server database for SRM via the tools that Oracle Server provides.
This information provides the general steps to configure an Oracle Server database for SRM. For instructions on how to perform the relevant steps, see the Oracle documentation.
- When creating the database instance, specify UTF-8 encoding
- Grant the SRM database user account the connect, resource, create session privileges and permissions
For a typical VMware SRM + Tintri VMstore deployment, you will need two Tintri VMstores: one in the protected site and the other in the recovery site.
The requirements for these VMstores:
- Both VMstores must to be running Tintri OS 3.1 or later
- Each VMstore needs to have a ReplicateVM license installed
- Each VMstore needs to have its respective/local (protected or recovery) vCenter Server configured as a hypervisor manager (in Settings àHypervisor managers).
This section provides information on configuring VMware SRM and the Tintri VMstore. It is assumed that you have met the prerequisites from the previous section, including:
- Have vSphere servers in both sites with the necessary licenses.
- Have fully-configured vCenter Servers in both sites managing all applicable vSphere servers, with the necessary licenses (OS and application).
- The 5.8 release of SRM requires the vSphere Web Client. For information about compatibility between vCenter Server and SRM versions, see vCenter Server Requirements in the Compatibility Matrixes for vCenter Site Recovery Manager 8 at https://www.vmware.com/support/srm/srm-compat- matrix-5-8.html.
- Have fully-licensed SQL Server database servers up and running in both sites.
- Each site can access any necessary AD servers, not protected by SRM, even in case one of the sites goes down in case of disaster (by leveraging AD native replication).
- Have the necessary SRM licenses (permanent or evaluation) and Tintri ReplicateVM licenses.
You must provide SRM with a system database source name (DSN) for a 64-bit open database connectivity (ODBC) connector in the Windows host you chose to install SRM Server on. The ODBC connector allows SRM to connect to the SRM database.
You can create the ODBC system DSN before you run the SRM installer by running Odbcad32.exe, the 64-bit Windows ODBC Administrator tool.
Alternatively, you can create an ODBC system DSN by running the Windows ODBC Administrator tool during the SRM installation process.
Note : If you use the embedded SRM database, the SRM installer creates the ODBC system DSN according to the information provided during installation. If you uninstall the embedded database, the uninstaller does not remove the DSN for the embedded database. The DSN remains available for use with a future reinstallation of the embedded database.
Here’s how to create the database instance to connect from SRM.
- Double-click the Odbcad32.exe file at C:\Windows\System32 to open the 64-bit ODBC Administrator
(Important: Do not confuse the 64-bit Windows ODBC Administrator tool with the 32-bit ODBC Administrator tool located in C:\Windows\SysWoW64. Do not use the 32-bit ODBC Administrator tool.)
- Click the System DSN tab and click Add.
- Select the appropriate ODBC driver for your database software and click Finish.
- SQL Server:
- Select SQL Server Native Client 10.0, SQL Server Native Client 11.0, or ODBC Driver 11 for SQL Server.
- Note: You may need to install the SQL Server Native Client from the SQL Server distribution ISO in case it’s not already installed in the Windows Host.
- Create an SQL Server data source for the
- Select SQL Server Native Client 10.0, SQL Server Native Client 11.0, or ODBC Driver 11 for SQL Server.
- Oracle Server:
- Select Microsoft ODBC for Oracle.
- Create an Oracle Server data source for the
- SQL Server:
- Click Test Data Source to test the connection and click OK if the test If the test does not succeed, check the configuration information and try again.
- Click OK to exit the Windows ODBC Administrator
The ODBC driver for your database is ready to use.
The SRM pre-installation checklist:
- Download the SRM installation file to a folder on the machine on which to install SRM.
- Verify that no reboot is pending on the Windows machine on which to install SRM Verify that no other installation is running, including the silent installation of Windows updates. Pending reboots or running installations can cause the installation of SRM Server or the embedded SRM database to fail.
- The user account that you use to install and run SRM must be a member of the local Administrators group. You can configure the SRM service to run under a specified user account. This account can be a local user or a domain user that is a member of the Administrators group on the machine on which you are installing
- If you are using certificate-based authentication, you must obtain the appropriate certificate You must use the same type of authentication on both sites. See SRM Authentication and Requirements When Using Trusted SSL Certificates with SRM.
- If you are using certificate-based authentication, provide the certificate for the remote site to the vSphere Web Client service on each
- Verify that you have the following information:
- The fully qualified domain name (FQDN) or IP address of the site’s vCenter Server instance. The server must be running and accessible during SRM installation. You must use the address format that you use to connect SRM to vCenter Server when you later pair the SRM sites. Using FQDNs is preferred, but if that is not universally possible, use IP addresses for all
- The user name and password of the vCenter Server administrator
- A user name and password for the SRM database, if you are not using the embedded
- If you use an SQL Server database with Integrated Windows Authentication as the SRM database, you must use the same user account or an account with the same privileges when you install SRM Server used when you created the Integrated Windows Authentication data source name (DSN) for SQL
The steps to install SRM Server are outlined here:
http://pubs.vmware.com/srm-58/topic/com.vmware.srm.install_config.doc/GUID-723EAC1B-AC21-4CAA- 9867-627CA8CB680A.html
After installing each SRM Server (in each site), you will need to also install the Tintri SRA in each site.
The Tintri SRA for VMware SRM can be downloaded from https://support.tintri.com/download/. The installation instructions for the SRA are also available from the same site, in the corresponding release notes.
Before you can use SRM, you must connect the SRM Server instances on the protected and recovery sites. The sites must authenticate with each other. This is known as site pairing.
Steps are outlined here:
http://pubs.vmware.com/srm-58/topic/com.vmware.srm.install_config.doc/GUID-8C233913-6C62-4068- BDD0-49B35D796868.html
After that is completed, the vSphere Web Client should look like Figure 30.
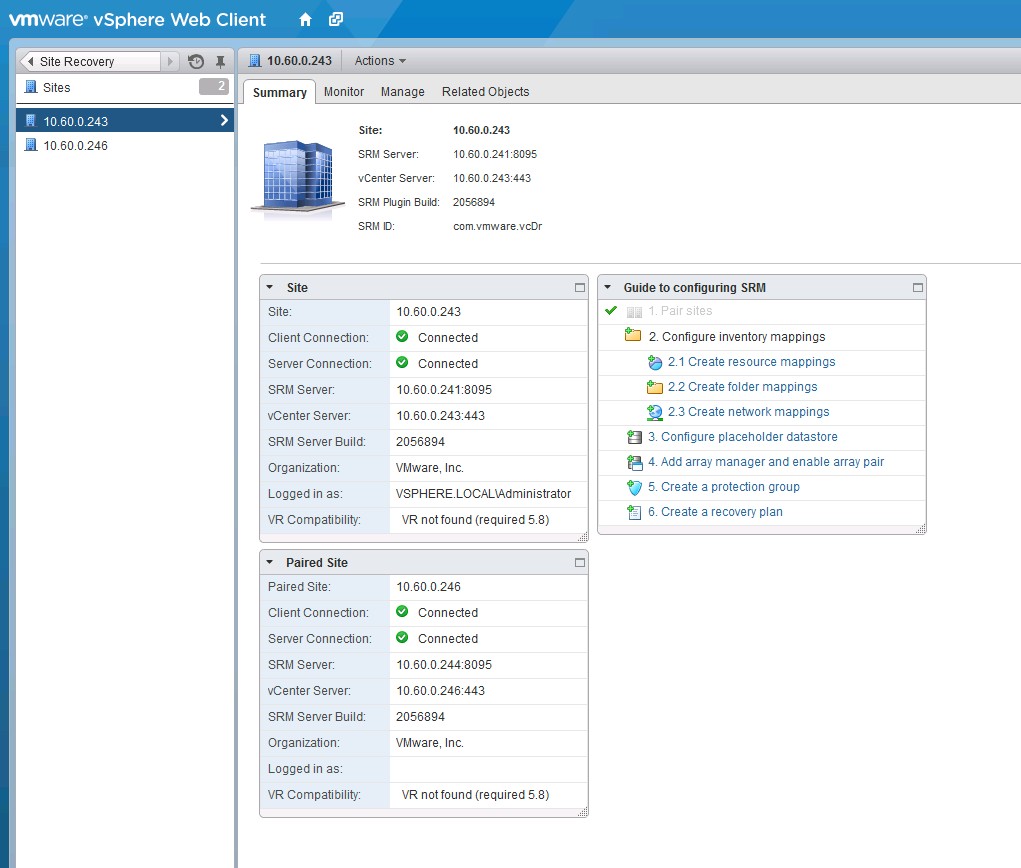
Figure 30. The summary tab after SRM site pairing.
SRM Server requires a license key to operate. Install an SRM license key as soon as possible after you install SRM. Follow the steps outlined here:
http://pubs.vmware.com/srm-58/topic/com.vmware.srm.install_config.doc/GUID-BA06E6CB-C937-4629- A38A-D0342CCC21CA.html
The next step is to configure inventory mappings.
You must create inventory mappings so that SRM can create placeholder VMs.
Inventory mappings provide a convenient way to specify how SRM maps VM resources at the protected site to resources at the recovery site. SRM applies these mappings to all members of a protection group when you create the group. You can reapply mappings whenever necessary; for example, when you add new members to a group.
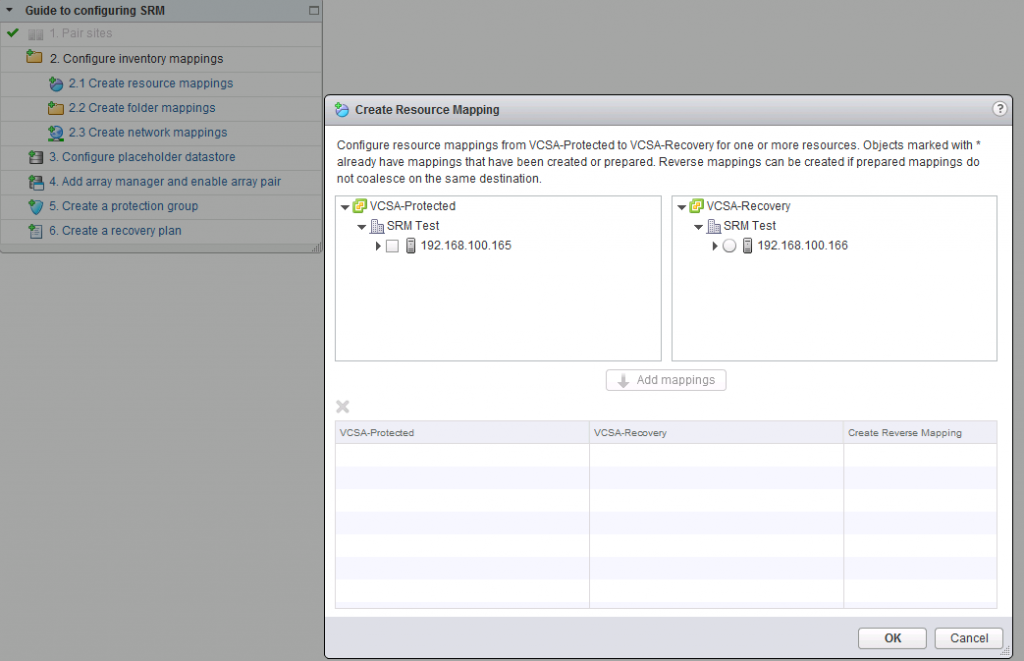
Figure 31. Accessing the configure inventory mappings wizard.
This is done in three steps: create resource mappings (Figure 33), create folder mappings (Figure 32) and create network mappings (Figure 34). Each step can be accessed by clicking the respective link in the “Guide to Configuring SRM” as shown in Figure 31 (accessible by going to Site Recovery –> Sites –> <Protected Site> –> Summary in the vSphere Web Client).
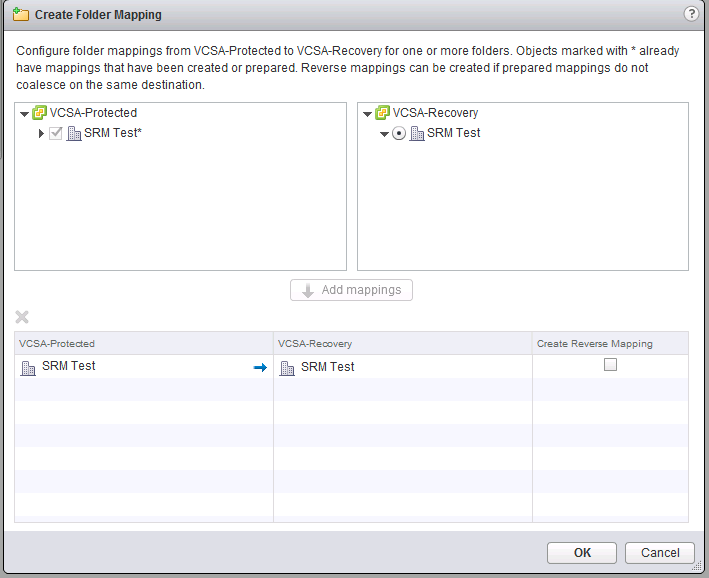
Figure 32. Creating the folder mapping.
In this step, you simply select the resources (e.g. a vSphere server) you want to map in the protected site (in the left pane), and then the equivalent resource in the recovery site (i.e., a different vSphere server located in the recovery site).
This step allows you to map the virtual networks in the protected site to their equivalents in the recovery site.
The next step is to set placeholder datastores for each site (Figure 35). Note that these datastores do not need to be shared or replicated. They are used to keep the .vmx files (not the .vmdk files) on the site that is inactive (recovery site when everything is OK, and the protected site after a failure). In this case, it is a local hard drive in each site.
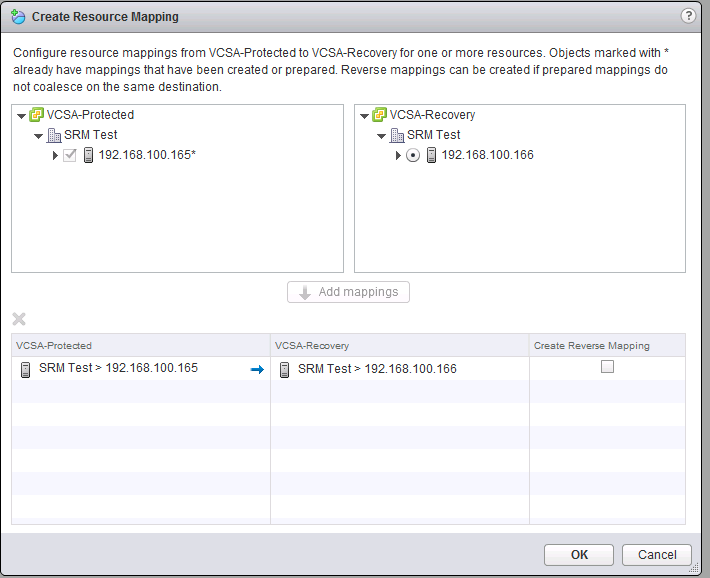
Figure 33. Creating resource mapping.
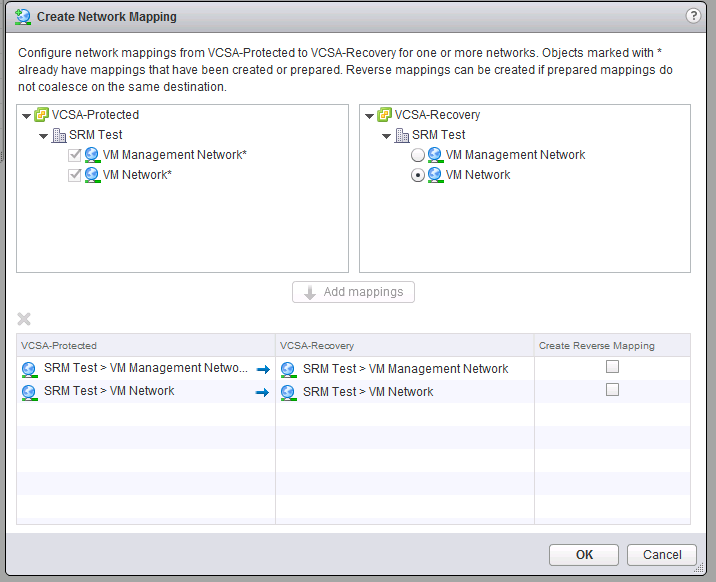
Figure 34. Creating the network mapping.
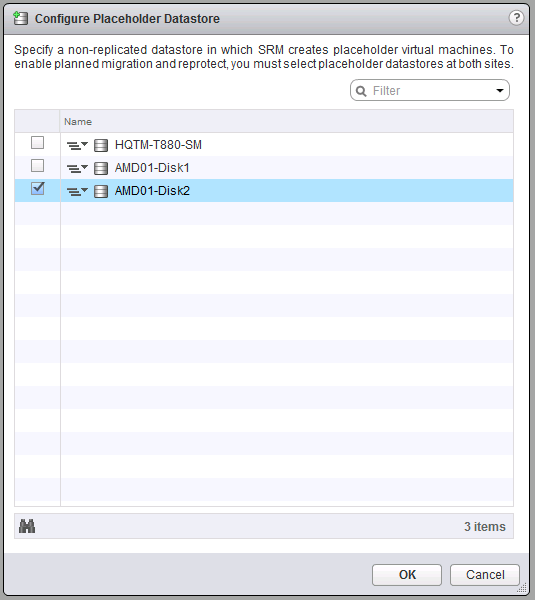
Figure 35. Configuring the placeholder datastore.
Now it’s time for the configuration steps that involve the pair of VMstores you are going to be using.
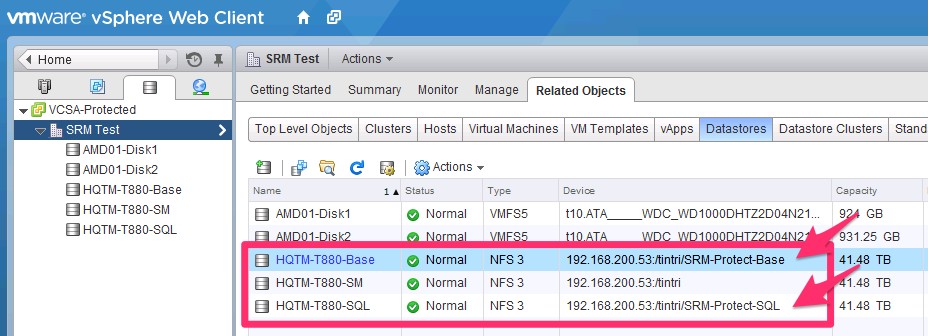
Figure 36. Moving virtual machines into datastores.
- Each VMstore needs to be configured and mounted in each respective vSphere/vCenter as a datastore: one datastore for each group of VMs to be protected (there will be a mapping between SRM protection groups and datastores/mount points on the VMstores).
- For SRM, you cannot use the VMstore’s default /tintri folder. You will need to create folders under /tintri (e.g. /tintri/SRM-Protect-Base) and mount those as additional datastores.
- Create one folder for each protection group you intend to
- Use the datastore browser or a standard NFS client to create the extra folders.
- Mount each folder as a different datastore in the vSphere
- Move the VMs you want to protect into the respective datastore (again: each datastore will mean a specific SRM protection group). See Figure 36.
- Create one folder for each protection group you intend to
- For SRM, you cannot use the VMstore’s default /tintri folder. You will need to create folders under /tintri (e.g. /tintri/SRM-Protect-Base) and mount those as additional datastores.
- Go to the web GUI of the Tintri VMstore at the protected site (Figure 37) and create a replication path to the VMstore in the recovery site by going to Settings/Replication.
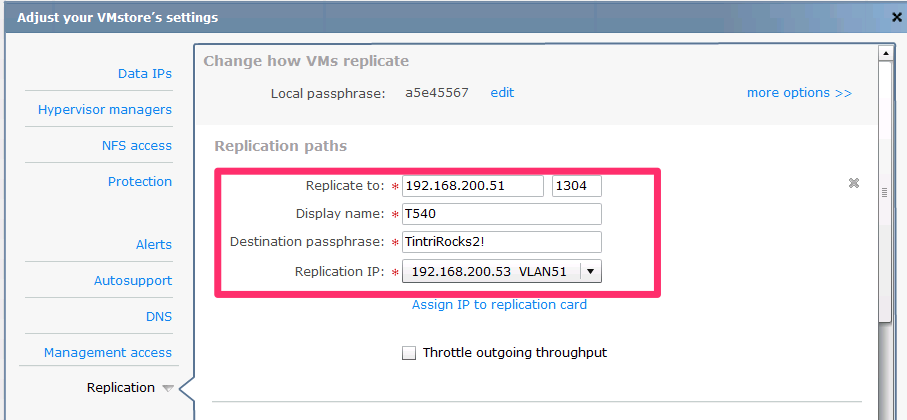
Figure 37. Creating a replication path to the VMstore.
If the “Replication” option is not visible in your Tintri GUI, it is likely that you don’t have a ReplicateVM license installed. If that is the case, please obtain a ReplicateVM license from Tintri, and follow the steps under the “Configuring Licenses” section of the Tintri VMstore System Administration Manual.
Don’t forget to click “Test Paths” before you click Save, as shown in Figure 38.
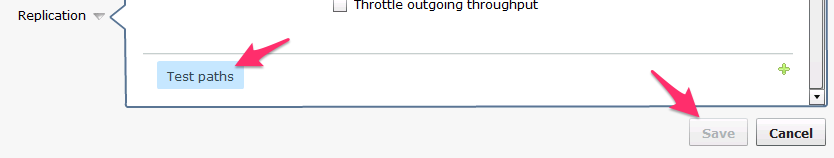
Figure 38. Click “Test Paths” before clicking “Save” here.
Also in the Tintri GUI, create a Service group by going to Virtual Machines/Service groups and clicking “Create group…” Give it a name and select which datastore / mount point you want to protect / replicate.
Note: If the datastore/mount point you just created and moved VMs to doesn’t show up in the dropdown, that means the VMstore hasn’t seen it yet; it can take up to 10 minutes to appear.
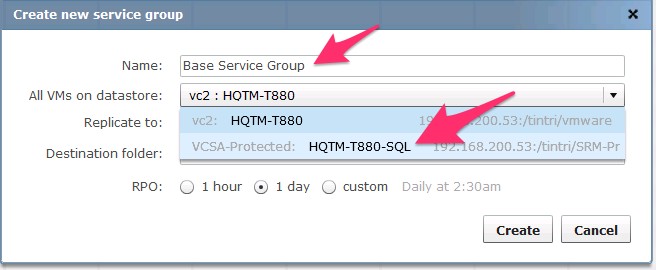
Figure 39. Selecting a replication path for the virtual machine.
Select the right replication path, as shown in Figure 39.
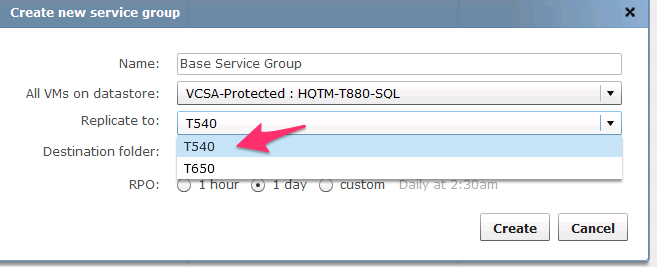
Figure 40. Replicating to multiple service groups.
You can leave the destination folder as the default (“srm”) or change it if you intend to have multiple service groups go into the same VMstore. See Figure 40.
Note: You do not need to create the destination folder yourself; it will be created for you automatically. Furthermore, even if the folder already exists, VMstore will also automatically create a unique name (e.g., srm.1), but still show it as you have input it in this page (e.g., srm).
It’s time to configure the RPO (i.e., how frequently replication occurs, which results in the max age of a recovered VM). With Tintri OS 3.1, the shortest possible RPO is 15 minutes, which can be obtained by selecting a custom interval, then Hourly and then clicking the “minutes past the hour” box, as shown in Figure 41.
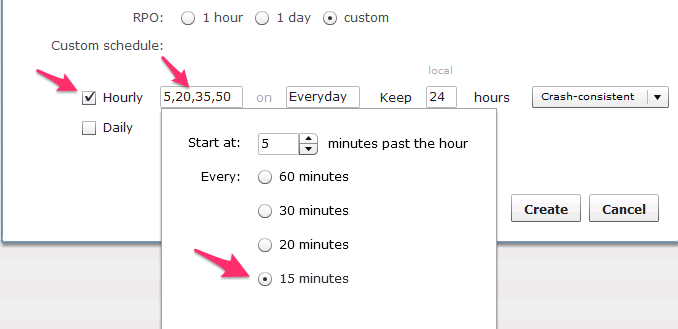
Figure 41. Setting a custom RPO interval.
Configure whether the replicas need to be “Crash-consistent” or “VM-consistent,” as shown in Figure 42.
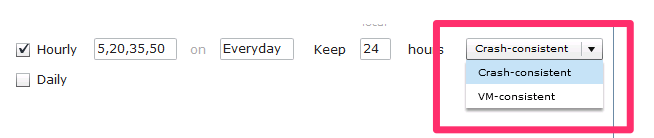
Figure 42. Choosing replication consistency.
The default setting is Crash-consistent, which means that when the VMs come up in the recovery site, they will do so as if the power plug had been pulled out; they will cold boot and check the file system, etc.
You can, however, select “VM-consistent,” which means that before taking a Tintri snapshot for replication, the VM will be quiesced by leveraging VMware Tools and VSS.
The disadvantage of using VM-consistent snapshots in any VMware environment, irrespective of whether a VMstore is being used, is that if the VMs perform heavy IO, VMware’s quiesce process can take minutes and negatively impact the performance of the VM.
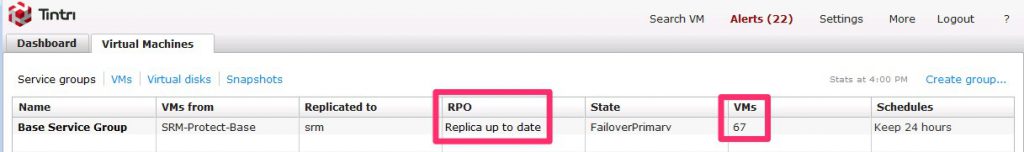
Figure 43. The newly-created service group, showing the number of virtual machines, among other information.
This may be OK if the RPO is long and the snapshots are taken during low-IO periods, but an RPO of 15 minutes may generate frequent snapshots during high-IO periods, resulting in unacceptable performance.
After pressing “Create,” you will see your newly-created service group show up in the GUI, as shown in Figure 43. Note the number of VMs shown and keep an eye on the “RPO;” this will be updated as replication is performed.
The VMstore in the recovery site will automatically be updated with the “other side” of the service group, as you can see in Figure 44. In this example, this will be shown on the recovery VMstore.
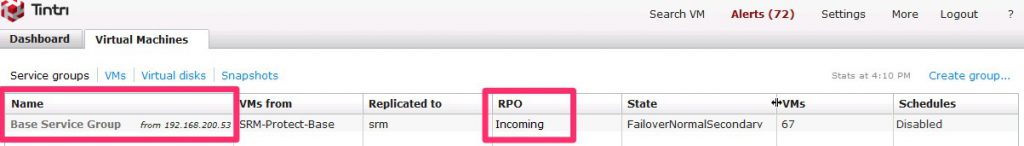
Figure 44. The new service group, with updated information.
Now it’s time to go back to the vSphere Web Client and continue the steps to configure SRM. The next step is to “Add array manager and enable array pair,” as shown in Figure 45. First you are asked if it’s really adding a pair, or only a single one; at this stage, it is the former.
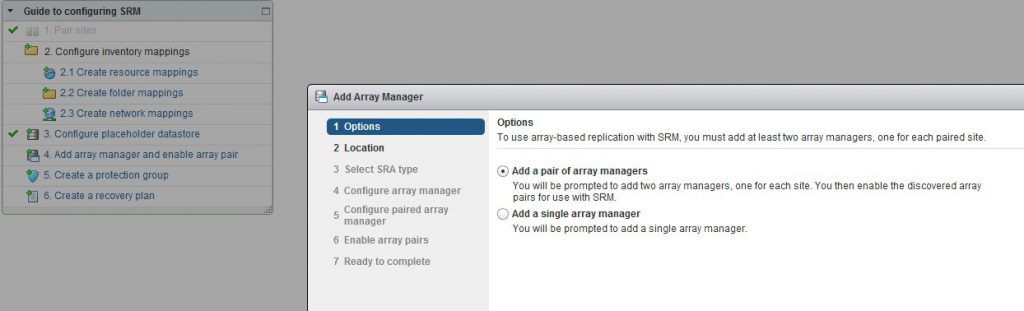
Figure 45. Setting up the pair of array managers.
Pressing Next takes you to the Location dialog (Figure 46), which, since you have already paired the two vSphere servers (sites), should be pre-populated with the right information.
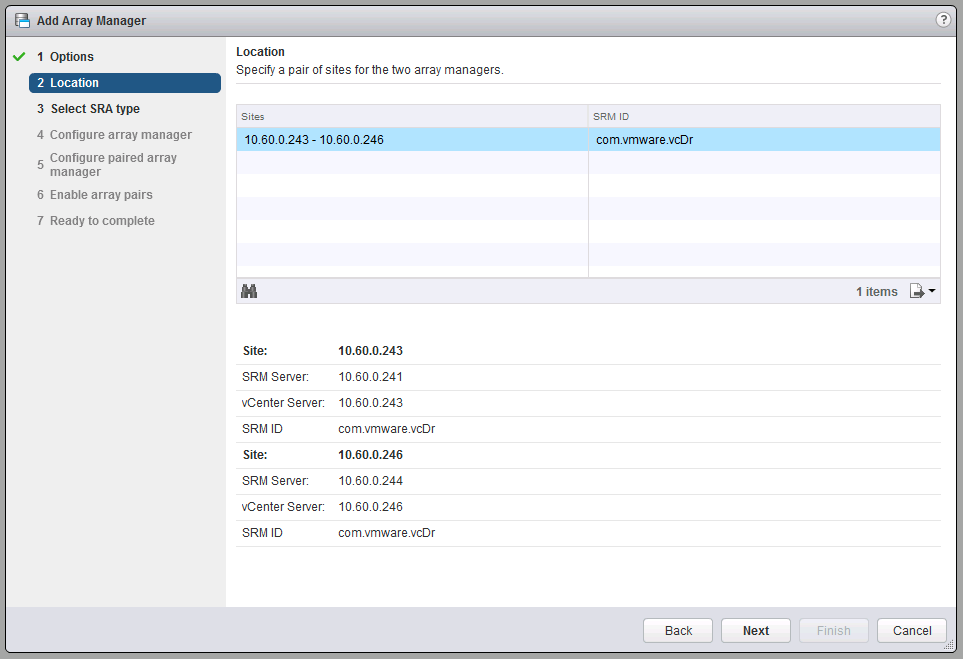
Figure 46. Specifying the location for the array managers.
Next comes selecting the SRA (Figure 47), which, if you installed the SRA in the SRM servers as mentioned earlier, should also be correctly pre-populated.
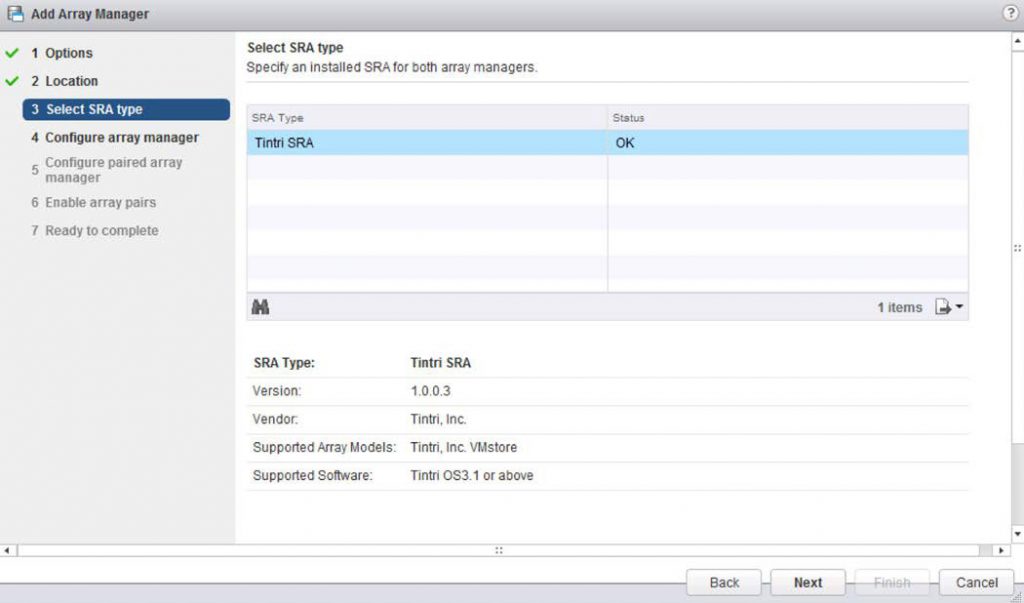
Figure 47. Selecting the SRA type.
After that you will be asked for the VMstore information in the protected site, as shown in Figure 48.
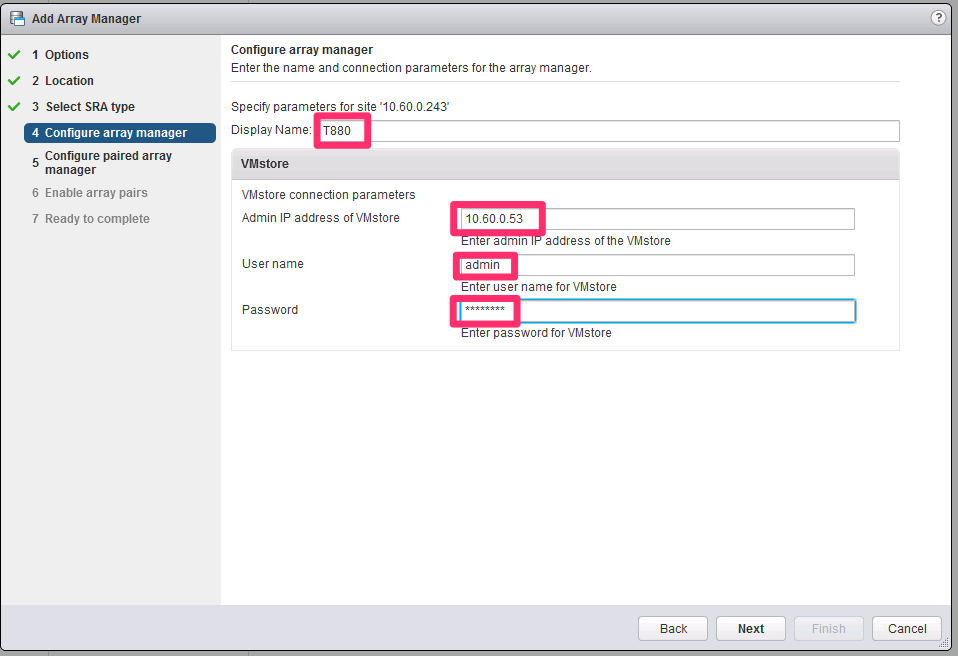
Figure 48. Adding VMstore information.
Note: if you forgot to create a protection group in the VMstore in the “Configure array manager” screen, you will get an error after you click “Next” and will not be able to proceed. If that happens, please go back to Figure 36, “Configure the Tintri VMstores.”
If the protected site’s array manager configuration is successful, it is then time to add the information for the VMstore in the recovery site:
The next screen (Figure 49) is also auto-populated, with the newly discovered array pair.
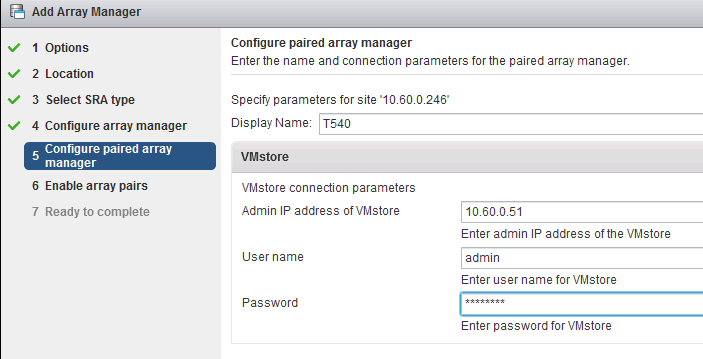
Figure 49. The paired array manager information.
(The array pair that is not selected and says “No peer array pair” shows a replication path that was configured to a different VMstore (i.e., one that is not the one in the recovery site).
Even though that other replication path does show up, because the additional VMstore is not configured in SRM (as it shouldn’t be, since there’s no protection group associated with it), SRM doesn’t see it as an array pair and it can’t be selected.
Figure 50 shows the last step in the array manager creation.
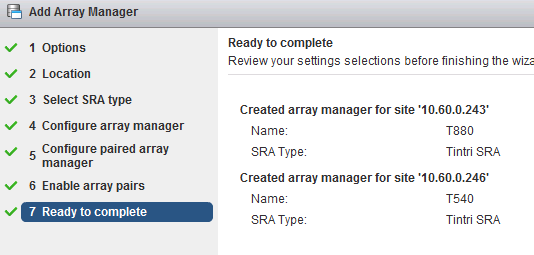
Figure 50. The completed array manager settings.
This is a good point for a quick sanity check.
Go to Site Recovery —> Array Based Replication and select the VMstore in the protected site, then select the “Manage” tab and look under “Array Pairs.”
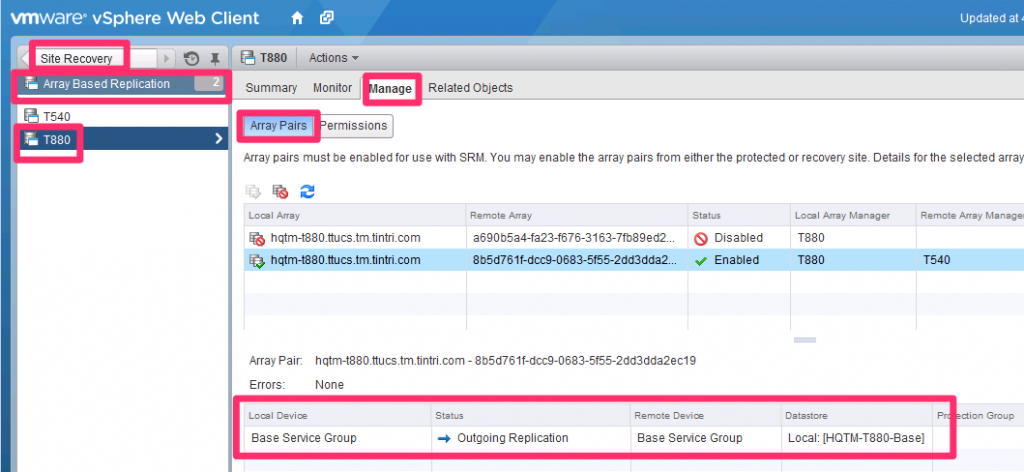
Figure 51. Checking your work.
Select the Array Pair you just created, and you should see (as shown in Figure 51) no errors, and a table containing:
- Local Device. This is the name of the service group created in the Tintri GUI
- This is the “Outgoing Replication.”
- Remote Device. This is also the name of the Service Group you created in the Tintri GUI
- This is the name of the datastore you’re replicating / protecting in the protected site.
If all looks correct, it is time to create a Protection Group.
Give it a name, as shown in Figure 52.
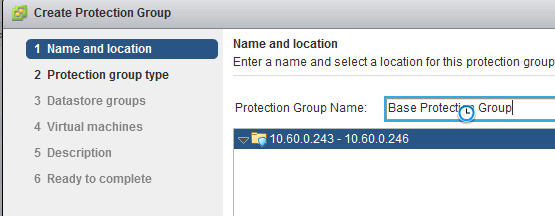
Figure 52. Creating the protection group.
The type should be already correctly selected by default (Figure 53).
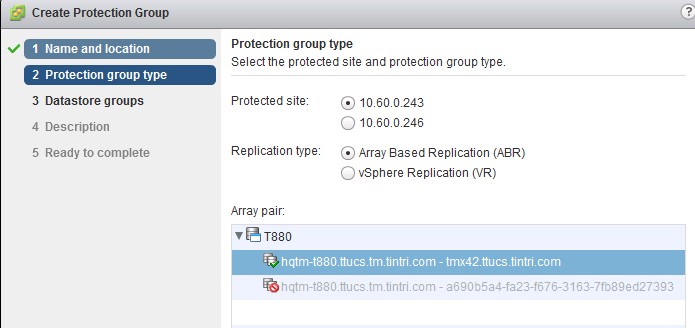
Figure 53. The protection group type is already selected.
You’ll need to correctly select the datastore in the next screen, shown in Figure 54 (make sure you select the one which is already being replicated by the VMstore):
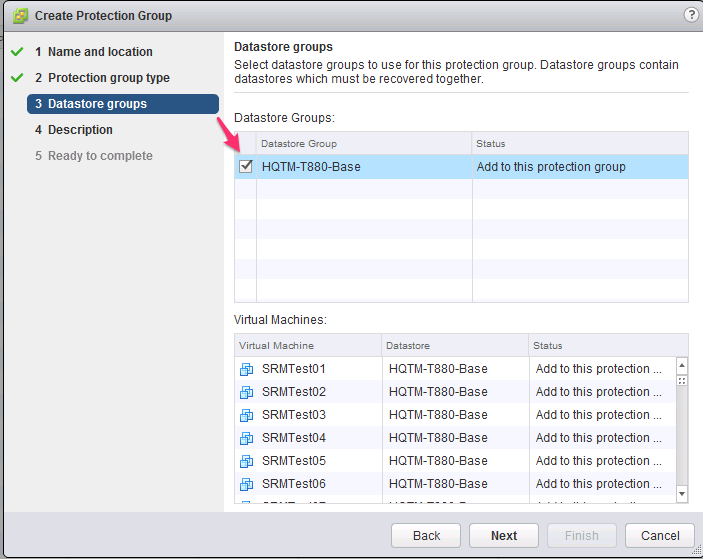
Figure 54. Select the datastore already being replicated.
The VMs residing in that datastore will be automatically selected. There is no way to unselect (unprotect) certain VMs here; that’s why a dedicated datastore was created for them (so that only the ones you want to protect get replicated and protected).
Next comes an optional description. SRM will be working on the VMs for a few minutes to protect them. Once that’s finished, the Protection Status changes to “OK”, as shown in Figure 55.

Figure 55. When you see “Protection Status” set to “OK,” you’re done.
Now it’s time to create the recovery plan, the last configuration step, right before testing SRM.
First, give it a name, as shown in Figure 56.
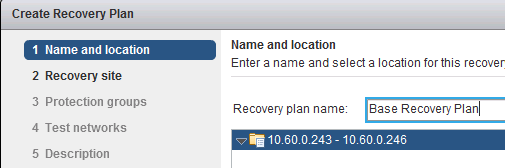
Figure 56. Naming the recovery plan.
Then, select a recovery site (the default should be correct), as seen in Figure 57.
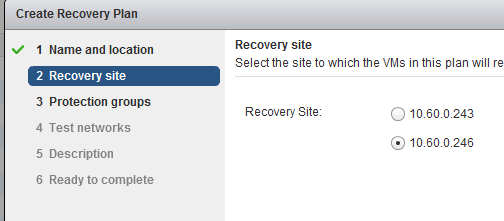
Figure 57. Selecting the recovery site.
Next, the protection group (which you just created), which you can see in Figure 58.
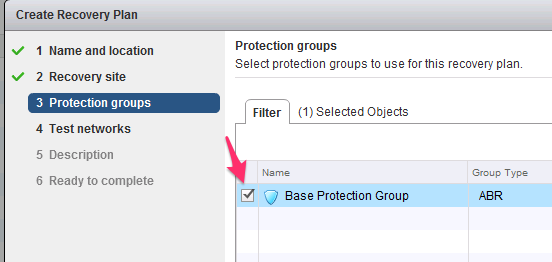
Figure 58. Selecting the protection groups.
Test networks are next (Figure 59). By default, SRM will place each VM in an isolated “bubble” network for a test, and not connect the machines to an actual physical uplink.
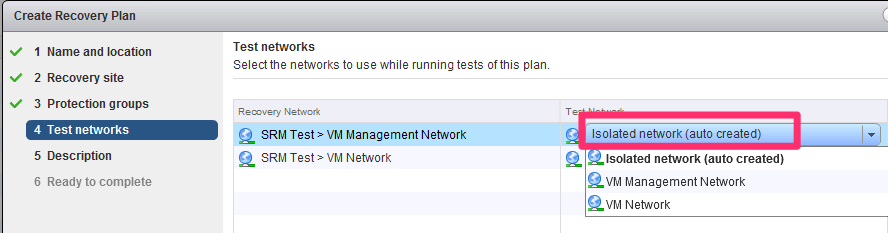
Figure 59. Select the test networks for the recovery plan.
Then there’s an optional description, and that’s it.
Recovery plans are ready immediately after creation, as shown in Figure 60.

Figure 60. The completed, ready-to-go recovery plan.
Previous sections showed the entire configuration needed. Now it’s time to do a test recovery plan.
As explained earlier, a recovery plan doesn’t actually fail over the VMs to the recovery site; it synchronizes the replica VMs and then enables (powers up) the VMs in the recovery site, in a test (isolated) network. That shows the replica VMs are OK and working.
What it doesn’t do is disable the VMs in the protected site and yield full control to the VMs in the recovery site. Yielding full control would mean that the recovery site VMs would now be the primaries, be connected to the production network and be the authoritative copy.
In a test run, the protected site still has the authoritative copy of the VMs, and when the test ends and SRM cleans up, it simply shuts down the recovery VMs and overwrites them with a new replica from the protected site.
In an actual failover/failback scenario (as we’ll see), the VMs in the recovery site have to be replicated back to the protected site before they are brought up.
A typical test recovery plan is shown in Figure 61.
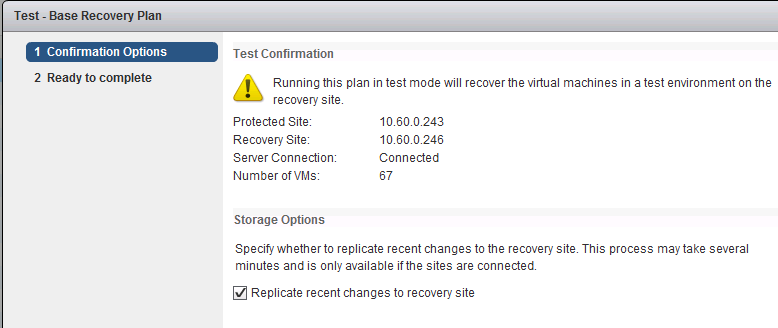
Figure 61. Confirm the test plan options here.
The Monitor tab (Figure 62) will show you what’s going on as it happens.

Figure 62. The “Monitor” tab updates the test’s progress.
Figure 63 shows the screen after a successful test; note how blazingly fast the replication happens; there are 67 live VMs that get replicated in about a minute by the VMstore. This is made possible because the VMstore replicates only changed blocks after deduplication and compression.
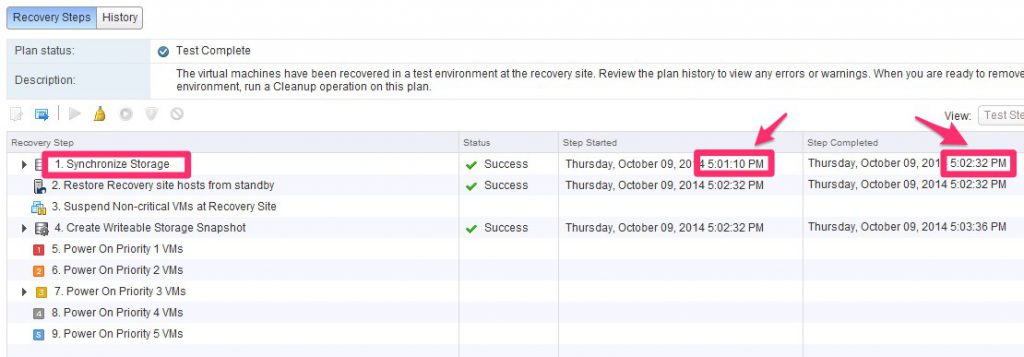
Figure 63. Note how quickly all 67 virtual machines have been replicated by the VMstore.
Figure 64, from the Tintri GUI, also shows how little impact the replication process has had on the protected VMstore, even if it’s set to replicate every 15 minutes and there are 67 extremely active VMs.
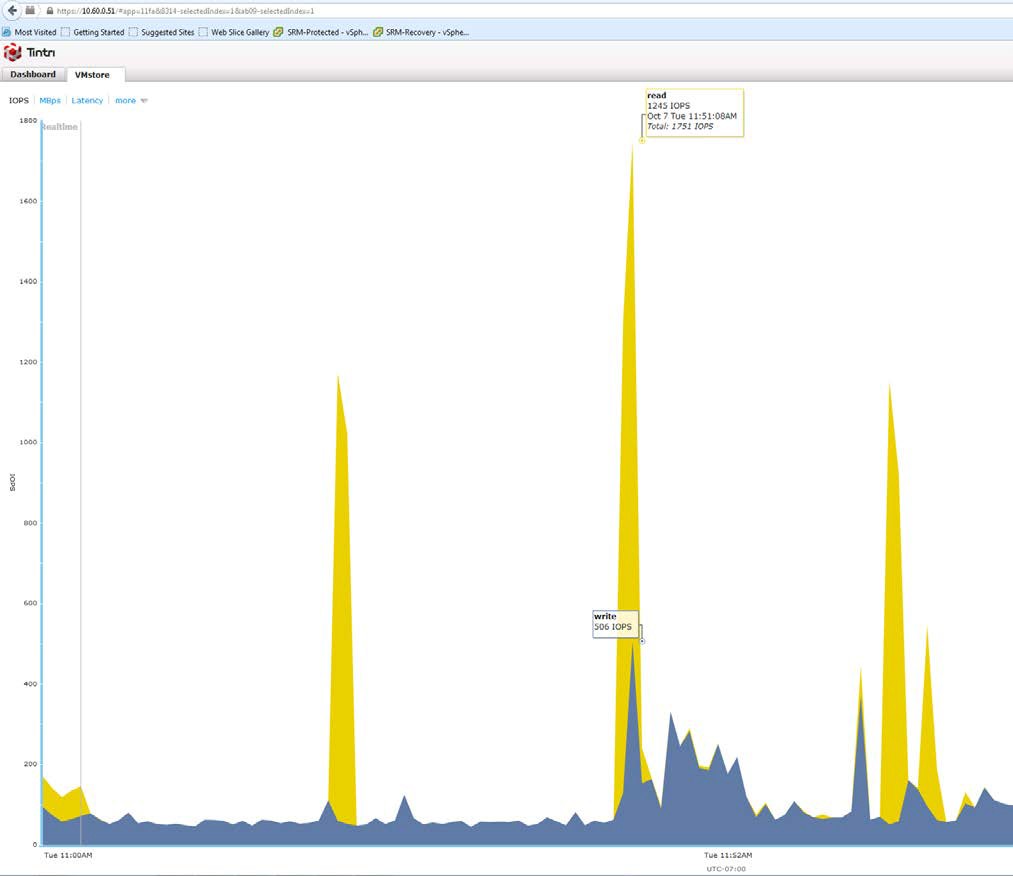
Figure 64. Replication doesn’t impact VMstore very much.
After a test, don’t forget to press the Cleanup button (Figure 65), or DR won’t work correctly. A cleanup, among other things, removes the test network from the recovery site.

Figure 65. Beginning the important cleanup phase.
A recovery plan should only be actually run if there’s some kind of event at the primary (protected) site that mandates it. A recovery plan should not be run for testing purposes; that’s what the Test feature (described in the previous section) is for.
If you do run a recovery plan, the recovery site will completely take over and the VMs in the protected site will be taken down.
Even if there’s an actual DR situation (the protected site goes down hard), you will still need to run the recovery plan as soon as you get the chance. This is because the recovery plan process does a lot of housekeeping items that don’t necessarily get performed automatically if the protected site goes down.
The only difference is that when you run the recovery plan in a DR situation (rather than a planned migration), you select a different option when you trigger it, as shown in Figure 66.
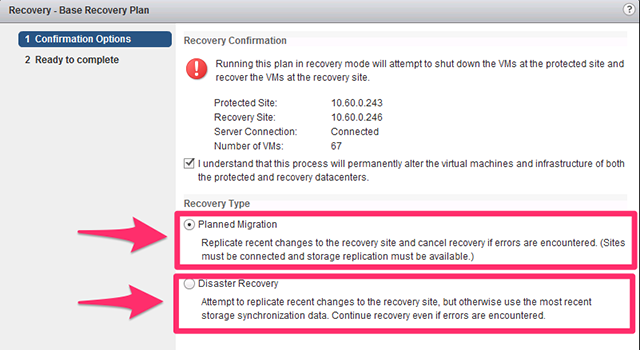
Figure 66. Make sure to check the proper recovery type.
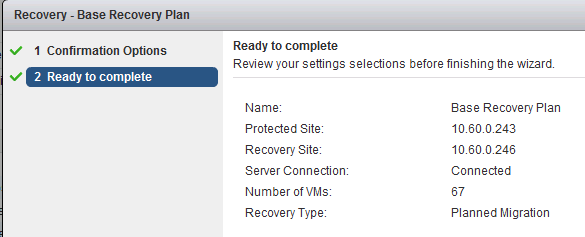
Figure 67. Confirm the recovery plan for Site Recovery Manager.
SRM needs confirmation before proceeding, as seen in Figure 67.
(DR and planned migrations were tested in writing this document.)
In the DR case, the recovery site was running recovered VMs in fewer than two minutes after the plug was pulled on the protected site.
The whole recovery plan process (including housekeeping) took about four minutes in both cases.
After a recovery plan has completed (successfully), the failback to the protected site is performed by clicking the “Reprotect” button, shown in Figure 68.

Figure 68. Failback to the protected site.
With SRM and Tintri, pressing the button will perform the reversal fully automatically; the replication will automatically be reversed, as shown in the vSphere Web Client (Figure 69).
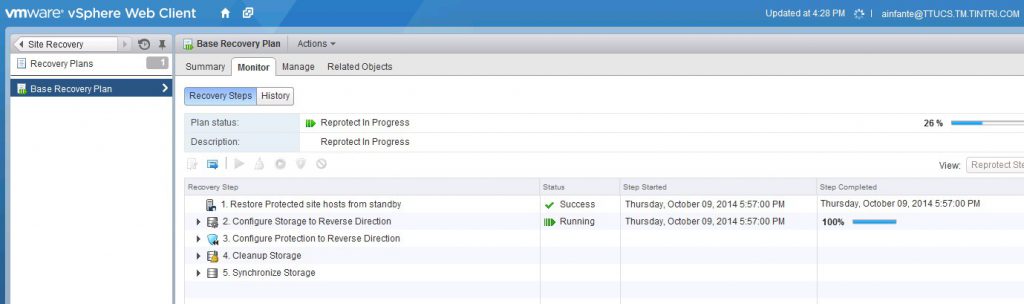
Figure 69. The vSphere view of the completed recovery.
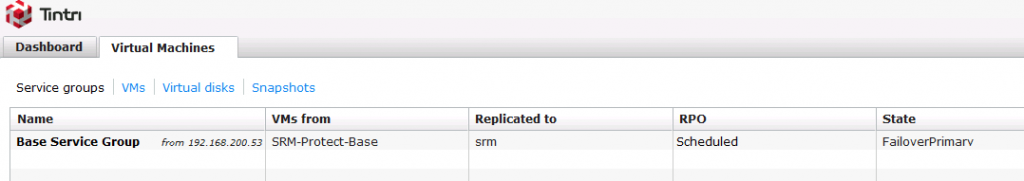
Figure 70. The Tintri view of the same recovery.
It will also be shown in the Tintri GUI; Figure 70 shows what the recovery site VMstore looks like (note the “State” shows “FailoverPrimary”). The protected site VMstore in Figure 71 shows a state of “FailoverFormerPrimaryExpectingReverse”.
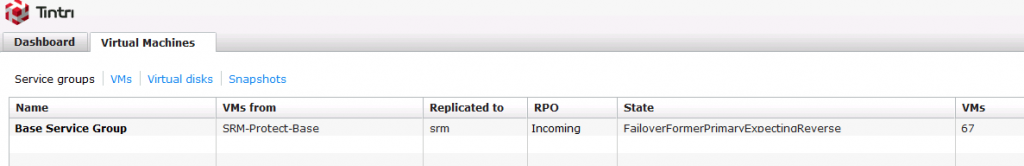
Figure 71. The protected site VMstore, with the updated State.
Tintri VMstore was designed from the ground up for virtualization and cloud workloads, and purpose-built to take full advantage of flash technology.
Tintri’s legendary ease of use and low TCO now extends to VMware SRM, too: you can have your SRM- based DR environment up and running in mere minutes, with low maintenance and an unbeatably low TCO.
Data Center Management and Scale
A Simple Out-of-the-Box Experience
Tintri provides a simple, out-of-the-box experience, simple configuration, and easy upgrades. In fact, it’s so easy to use that it redefines time to productivity.
Traditional storage vendors emphasize time from box to rack, or time to command prompt, or time to format the first RAID. But this doesn’t encompass all the choices the customer has to make. The decisions include:
- Which RAID configuration to use
- Optimizing for random or sequential IO
- The number of LUNS or volumes needed to break up a multi-terabyte array
- Whether to use NFS, iSCI or some other topology
- The real time it takes to set up an array from unboxing until deployment, including moving existing VMs to the new array
Tintri understands those concerns, which is why it was built with the goal of minimizing time to productivity. It starts with zero low-level storage configuration. Simply rack the unit, plug it into the network, give it an IP address, connect it to the hypervisors and start migrating or deploying VMs. It takes place in less than 1 hour; usually less than 30 minutes, in fact.
How is this possible? It starts with the fact that the RAID is installed to “best practice” standards — RAID 6, hot spares, parity disks — at the factory, ready to go. None of this is exposed to the user for customization. The result is zero configuration.
In addition, the Tintri file system can be highly-optimized for a single standard configuration. This is preferable compared to a less-optimized solution that needs to be flexible enough for an almost infinite number of possible storage configurations, including:
- Different RAID types
- Different RAID sizes
- Caching options
- Block types
- NAS types
Also, note that Tintri is Ethernet-only. This is purposeful, as supporting both Fibre Channel and Ethernet requires optimizing two very different physical protocols.
The Tintri file system is a single RAID group, making it effectively a single LUN/Volume. This means dedupe and compression happens across all VMs, containers and objects in the file system.
In addition, the Tintri file system is separate from the data transport protocol, which means it can support multiple concurrent hypervisors without partitioning the file system; the underlying file system is one unit.
Currently, Tintri supports NFS for most hypervisors and SMB3 for Hyper-V to move the data between Tintri system and hypervisors. But creating separate SMB3 and NFS volumes for each hypervisor does not have be done, avoiding the problems of guessing wrong about the sizes needed. More transport protocols can be added without affecting the file system.
Each Tintri array shows up as a single “datastore” object in each hypervisor, regardless of how large it is, anywhere from 10TB to 640TB. This greatly reduces the number of storage objects needed to manage by a factor of 20 times or more compared to traditional storage. In traditional storage scenarios, a single array is often broken up into 20 or more LUNS or volumes, each of which needs to be managed.
Configuration Issues
As mentioned before, Tintri’s configuration for storage constructs is zero. Configuration is concentrated instead on storage services: snapshots, replication, copy data management, cloning, etc.
When you consider that network configuration is still not plug and play, the value becomes clear. Complexity is reduced by only having to configure networking for 1 LUN or volume, vs. multiple ones.
Since all Tintri configuration is per-VM or per-VM group, policies take effect instantly and change instantly, in place, without having to move objects from a LUN with one policy to another LUN with another policy. That is an inefficiency which has to be scheduled to reduce delays in production. The type of in-place policy management offered by Tintri reduces the friction of managing these policies.
Tintri’s advanced technology also helps smooth the rough edges of typical storage. Things like array offloading for storage live migration for VMware (using VAAI and lots of Tintri software) and Hyper-V (using SMB3 ODX) reduces the non-application-centric considerations for making changes to storage by greatly reducing or eliminating the storage impact of balancing a storage pool, by live migrating VMS from one storage to another.
Upgrades
Individual Tintri systems are balanced between CPU/Memory and storage capacity to deliver predictable, high-performance computing. Here are just two examples of some of the available upgrades to make it even better:
- The All-Flash Series EC6000 allows drive-by-drive capacity upgrades for up to 7,500 virtualized applications in just two rack units.
- Dual controllers in active-standby HA configuration allows you to upgrade the controller software during production, with no loss of performance.
Tintri also makes it easy to upgrade to the latest codebase, so they can take advantage of the latest features.
VM Awareness Makes Management Simpler
The goal is manage the apps and VMs, and not the storage. Tintri makes that happen. To start with, there are very few settings at the low storage level. Everything comes preinstalled with best practices.
That means management occurs at the VM level. Contrast that with traditional storage, which manages QoS, replication, snapshots, etc. at the LUN or volume level. In that setting, it’s necessary to be aware of which storage LUN your VM is in. If you move it, you lose a lot of things: snapshots, policies, historical info, and more. There may need to be a full storage live migration to move it.
Not so with Tintri. Policies can be changed on a VM without moving it; it takes place instantly, and does not affect other VMs. You never need to know which LUN or volume a VM is in to know what its policies are, since it’s a function of the VM, not its storage location.
This VM awareness also comes into play in the area of translation between VM and storage. Translation is one major reason it is difficult to do automation with traditional storage. Translation is not simple, and either requires very custom logic that turns into brittle, inflexible code, or a manual handoff which takes time.
Again, the advantage is with Tintri. With everything at the VM level, management and automation is much easier, since there’s no translating between VM and storage.
Finally, don’t forget about simplification. One array equals one datastore. That means just one thing to manage, from the storage point of view. Compare that to traditional storage, for Tintri’s largest 640TB array. It would not be unusual for the array to be split into 20-50 LUNs or volumes, each of which has to be managed as a storage object in the hypervisor. If you have 10 hypervisor servers, that’s 500 connections to be defined and maintained, vs. 10 connections with Tintri. It’s a no-brainer.
Tintri Global Center
Having an end-to-end view into the performance of individual VMs can be tremendously helpful in virtualized environments. This chapter discusses the challenges IT faces in pinpointing performance issues and how Tintri VMstore and Tintri Global Center deliver deep insight in to utilization and performance, helping IT detect trends and enhance troubleshooting.
Administrators can detect trends with data from VMstore and individual VMs, all without the added complexity of installing and maintaining separate software. This built-in insight can reduce costs and simplify planning activities, especially around virtualizing IO-intensive critical applications and end-user desktops.
To handle monitoring and reporting across multiple VMstore systems, Tintri created Tintri Global Center (TGC). Built on a solid architectural foundation capable of supporting more than one million VMs, Tintri Global Center is an intuitive, centralized control platform that lets administrators monitor and administer multiple, geographically distributed VMstore systems as one. IT administrators can view and create summary reports across all or a group of VMstore systems, with in-depth information on storage performance (IOPS, latency, throughput), capacity, vCenter clusters, host status, protection status and more (Figure 72).

Figure 72: Tintri Global Center extends deep insight across multiple geographically distributed VMstore systems and their resident VMs.
In addition to summary information presented at a glance, Tintri Global Center also provides the ability to filter and display results, including by individual VMstore systems and specific VMs, for easy troubleshooting.
TGC is an intelligent control platform that enables multiple Tintri VMstore systems to seamlessly function as one. TGC is built on an architectural foundation that is capable of supporting a maximum of 112,000 VMs on 32 VMstores running Tintri OS 3.0 or later, and retaining 30 days of historical data from all systems.
TGC provides centralized administration, scalable VM control and consolidated reporting. TGC enables IT teams to easily build out large deployments of Tintri VMstore systems to support virtualized environments without the complexity of traditional storage.
(TGC can run without a Tintri VMstore license and manage up to four VMstores for a 30-day evaluation period. After 20 days, a UI notification will display the number of days left for evaluation and an alert will indicate the end of the evaluation period. At the end of the evaluation, TGC will stop collecting VMstore information if no valid VMstore licenses are present.)
Use Figure 73 to size the TGC host, based on the number of VMs and VMstores in your cluster.
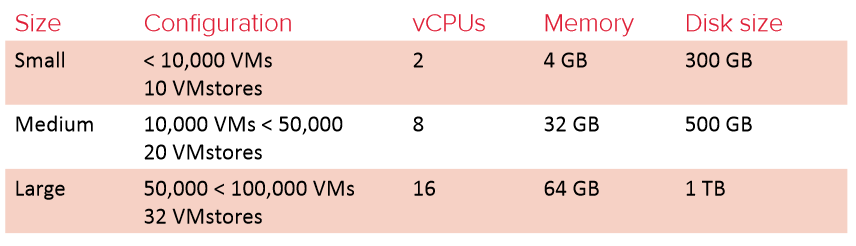
Figure 73. Guide to sizing Tintri Global Center.
Protection and QoS policies (snapshot schedules and replication) are controlled through policy management, and can be applied in bulk to all members of a service group.When a VM is moved between VMstores, its protection policy will follow it. If a VM policy is changed in the VMstore UI instead of TGC, the policy management setting is applied.
VM Policies and Service Groups
TGC allows you to manage VM policies at scale by setting policies through dynamic service groups spanning multiple VMstores, data centers, locations or hypervisors types.
TGC also reduces operational management tasks by making VM protection and replication policies vMotion resilient. Service groups allow you to dynamically group VMs based on rule, hypervisor path or naming patterns. VMs in service groups can reside across multiple VMstores, locations or hypervisor types. A VM can only be a member of a single service group.
In the case of a VM matching multiple service group rules, the last service group will take precedent in lexicographical order. Policy set at the service group level will be maintained in case of vMotion to another VMstore. Protection and replication policy can be set at the group level.
Service groups are logical groupings that can be created using:
- Hypervisor path (vCenter and folder in vCenter / RHEV manager and RHEV cluster / HyperV)
- Naming pattern
- VMs across multiple VMstores (as many as are managed in TGC)
Storage as a Single Pool
VMstore pools provides grouping of managed VMstores to use for VM Scale-Out, to enable administrators to manage storage resources. It provides recommendations to help balance space usage, flash usage and IO load for the VMstores. Each pool can have its own configuration, affinity and anti-affinity rules used by the VM Scale-Out engine to generate VM migration recommendations. Pool membership is static. The administrator has to add VMstores to a pool for it to be part of that pool. The pool collects and reports aggregated performance and capacity statistics. VMstore pools only work for VMstores running Tintri OS 4.2 or later.
Here are some of their important characteristics:
- VMs are not moved between submounts of different names, or between shares with different names.
- If a VMware datastore is: vmstore-1:/tintri, and another VMware datastore on the same vCenter is: vmstore-1:/tintri/vmware, VMs will not be moved between those two datastores. The pathname of the mount is examined to make this determination.
- Similarly, if a Hyper-V share is: //vmstore-1.example.com/VMs, and another Hyper-V share is: //vmstore-2.example.com/hyperv, the VMs will not be moved between those two shares.
VMstore Pool Recommendations
- Use the same submount or share name for all datastores that are accessed by the same set of hosts.
- Do not use the same submount name if you want to separate multiple tenants within the same VMstore pool. Use a different submount name for each customer.
- Each submount name should be present on at least two different VMstores. It does not need to be present on all VMstores, but the recommendation engine needs some choices for where to move. Submounts with only one occurrence are listed in the Notifications tab on the pool.
- If using VMware SRM, the SRM submount name should ordinarily be different than other submount names.
- This prevents recommendations from causing VMs to cease protection. If two SRM submount have identical protection policies, they can still load balance between them.
Cloud/Automation/Ecosystem Integration
Alignment With Private Cloud
IT infrastructure can be simplified through VM awareness. Tintri provides VM-aware storage that frees IT from having to worry about and orchestrate the complexities of LUNs, zoning, masking, and other storage specifics. Because all Tintri capabilities are provided at VM granularity, Tintri VMstore storage arrays add significant value in terms of allowing users to easily protect and replicate individual VMs.
This is crucial today, since the cloud has had a profound effect on the IT landscape. Enterprises are creating private cloud infrastructures to deliver a similar user experience as the public cloud, delivering the benefits of greater business agility and lower IT costs. Many enterprises are combining both private cloud and public cloud resources in a hybrid cloud model that allows them to take advantage of the predictable performance and costs of on-premises infrastructure, while being able to utilize the public cloud for special projects, bursts of activity that exceed on-premises capacity, and other special needs.
Many enterprise IT teams are deploying private clouds to allow on-premises infrastructure to offer the streamlined consumption model, improved agility, and economics of the public cloud.
Enterprises need to simplify and automate services available from existing IT infrastructure to achieve this goal, and there are three fundamental tools to help you get there:
- Cloud management platform or service catalog
- Orchestration
- Configuration management
The cloud management platform or service catalog is the entry point through which developers and enterprise IT users get the services they need.
Showback or Chargeback are often implemented here, as well as all approval policies necessary to ensure governance. A decision matrix guides users through the process of requesting the correct service without them having to know details of the underlying infrastructure, such as specifics of networking, storage, and servers.
The cloud management platform also adds a layer of multi-tenancy, which allows shared infrastructure resources to be consumed by multiple users and organizations. Multi-tenancy at the cloud management layer also enables additional advanced features such as quota management, which could be managed at the individual tenant level.
The orchestration layer is the glue that connects many of the disparate systems together. The orchestration layer ensures that all the tasks necessary to deliver a requested service, such as provisioning a new VM, are completed. It helps to think of the process of orchestration as building a task library (see Figure 74).
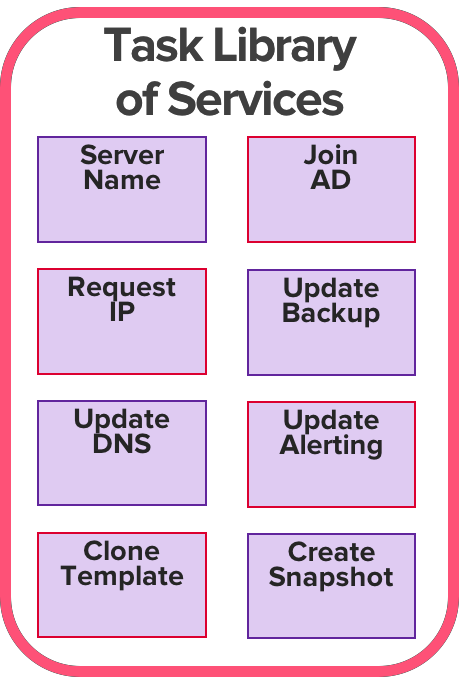
Figure 74. The orchestration process results in a library of tasks that are used to create more complicated workflows.
Each task is a piece of automation that enforces the standards and options required for your data center. These tasks can then be joined into an orchestration workflow (see Figure 75).
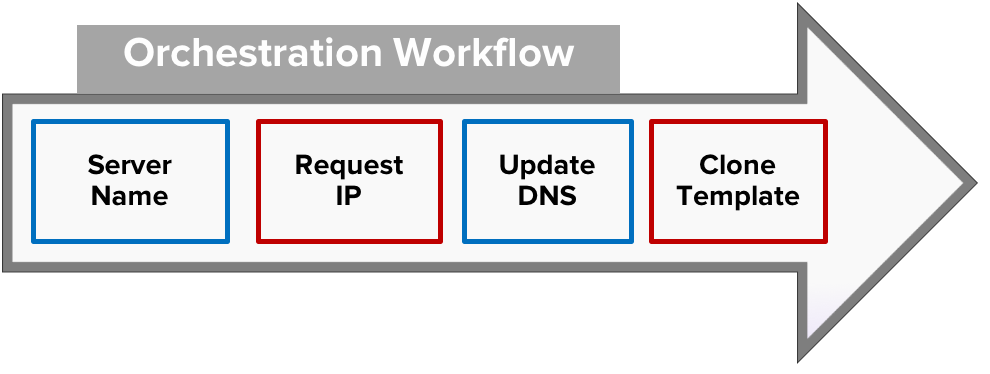
Figure 75. An orchestration workflow combines multiple tasks from your task library into the sequence needed to accomplish a more complex task such as provisioning a new VM.
Figure 76 shows a useful process flow for creating new services as part of your service catalog.
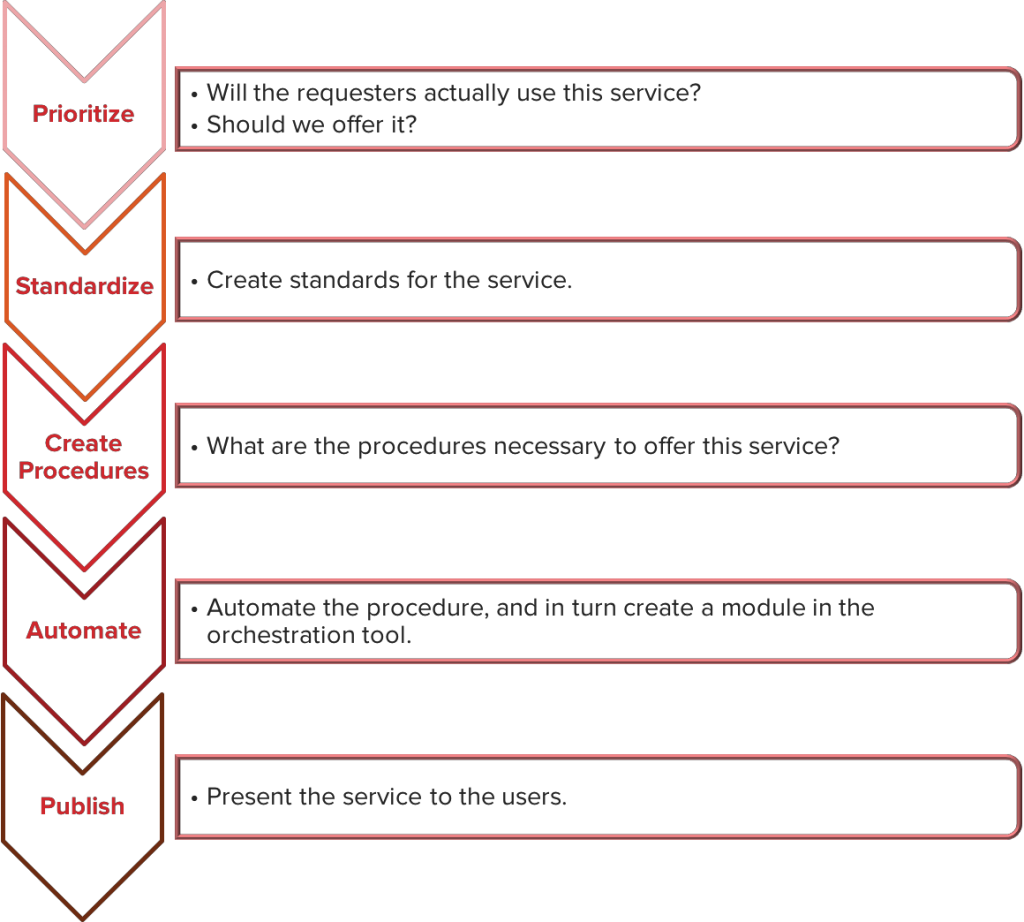
Figure 76. Process flow for service creation.
Configuration management software tracks all of the configuration items required for an IT system such as a server or a VM. In configuration management, you identify the modules that will be installed in each OS container, or external modules that will define configurations, as well as ensure they are enforced. Enforcement is a critical step as it changes the way you think about troubleshooting and making configuration changes.
Configurations are held in a central repository and pushed down to nodes (servers, devices, etc.) If someone changes a configuration manually, when the configuration management agent runs, it will set it back to the desired state.
Ecosystem Integration
VMware vRealize Automation has become a popular cloud platform supporting self-service for private and hybrid cloud deployments. VMware vRealize Orchestrator simplifies the process of creating fully custom workflows.
VMware vRealize Automation is a cloud automation software platform providing a self-service portal with a unified service catalog, and providing multi-vendor virtual, physical, and public cloud support. With vRealize Automation, you can offer Infrastructure-as-a-Service (IaaS) or higher-level services as your requirements dictate.
VMware vRealize Orchestrator is one of the most widely used orchestration tools in the industry. It is designed for use with both VMware vRealize Automation and vCloud. It allows you to easily automate complex workflows and includes an extensive library of prebuilt tasks for common administrative actions. It provides an SDK that supports the creation of specific plugins.
The Tintri vRealize Orchestrator plugin facilitates the integration and use of Tintri storage in vRealize environments that automates many common Tintri tasks. Think of these tasks as building blocks that you can then assemble into your desired workflows. Combine this with vRealize Automation, and you can offer self-service for provisioning of services, or you can offer a combination of Day 2 operational services. The Tintri plugin is beneficial for both enterprises and service providers, enabling your customers to access services that previously would have required a ticket and days or weeks of waiting.
This chapter explains how you can use the vRealize Orchestrator plugin to accomplish important storage tasks, including snapshots for VM protection, replication for DR, VM sync to update datasets in development and test environments, and QoS to manage performance service levels across large numbers of VMs.
Automation
Since Tintri VMstore systems let you focus at the VM level, automating tasks such as replication policies is much simpler. When automating storage policies for a VM, they are executed natively on the storage. The operational overhead of these tasks is minimal, as is the effort required to automate them.
To summarize Tintri benefits:
- Tintri makes storage simple, so you can spend more time automating and less time worrying about storage details such as
- Tintri gives you a VM-focused view, as well as a forward-thinking vision to integrate with public cloud services where
- Tintri facilitates automation via plugins and REST APIs
With the Tintri REST API, any automation tool can invoke Tintri-specific functions.
The Tintri snapshot capability is extremely useful for protecting VMs. An app developer can take a snapshot of a VM before an application push, or a Windows server engineer could snapshot hundreds of servers before they get patched.
Tintri snapshots operate on the VM itself, make very efficient use of data, and do not impose any performance overhead. Using the vRealize Orchestrator Snapshot Workflow, you can offer this capability as part of your service catalog or as part of a larger workflow.
The vRealize Orchestrator Snapshot Workflow is ready to use out of the box and requires a minimal amount of input to execute. In the first step, the user selects the VM from vCenter, as shown in Figure 77.
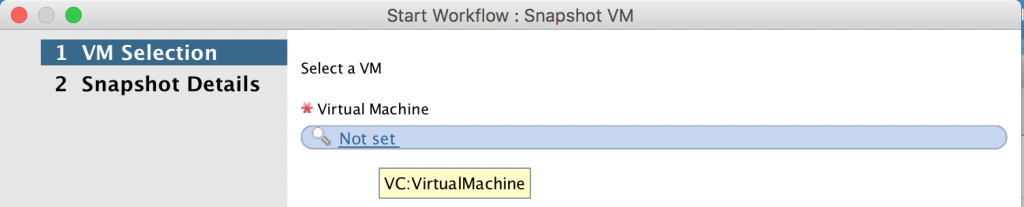
Figure 77. How to use the vRealize Orchestrator workflow.
In the second step, the user enters some additional information about the snapshot:
- Snapshot name: name of snapshot as it will appear on the Tintri VMstore
- Snapshot type:
- Crash-consistent
- VM-consistent
- Retention Minutes: number of minutes to keep the snapshot
You can find application-specific information on choosing VM-consistent versus crash- consistent snapshots at tintri.com/company/resources. The Tintri best practice guides you’ll find there often give guidance on this setting for specific applications.
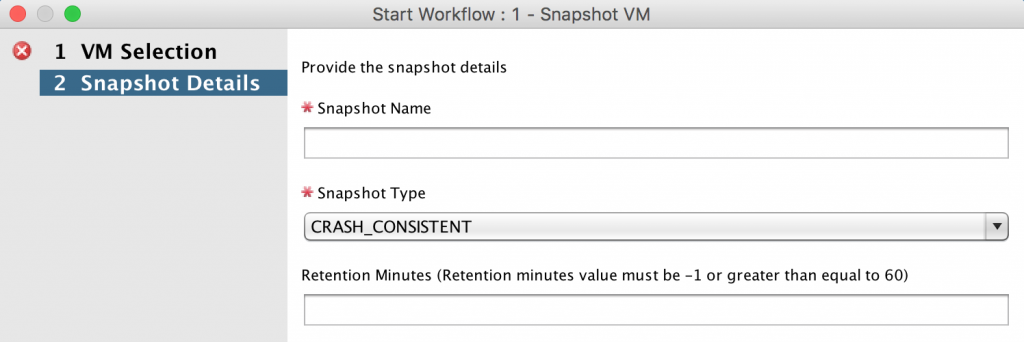
Figure 78. Snapshot details, including the type.
You should verify that the Snapshot Workflow executes successfully against a test VM (Figure 78). Then you can allow users to access and use it as-is, or create a workflow that incorporates the Snapshot Workflow.
Per-VM Isolation in a Self-Service Environment
Being able to set QoS at the VM level from a native storage perspective is unique to Tintri. You can guarantee each application its own level of performance and protect others by limiting their performance as well.
These capabilities change the way you approach the tiering of storage. No longer do you need to plan out your storage-based tiers on different pools of storage capabilities. You can use the same pool of storage, but have distinct levels of service based on the settings that make the most sense for your organization. When automation is combined with this feature, it opens up capabilities for both enterprises and service providers.
For enterprises, this feature gives you the ability to utilize a self-service portal to offer multiple performance levels. For most workloads, the default setting (no QoS assigned) allows the Tintri array to automatically adjust performance per VM. Workloads which need guarantees or specific limits can be configured to have these assigned per VM.
The option to expose QoS through a self-service portal is as simple as a dropdown. Contrasting this with traditional storage, VMs are required to be placed in the LUN or volume that matches the required storage tier. This requires decision workflows to determine if there is enough storage on a certain tier, or if policies for protection match that tier. Tintri VMstore systems eliminate the need for these workflows and decisions, because QoS and protection configuration are done at the VM level.
Service providers can build service tiers where customer VMs automatically get a specific maximum throughput. This gives you the option of charging for guaranteed IOPS. By utilizing logic at the automation tier, customers can automatically be placed into per-VM configurations that limit the maximum amount of IOPS. If customers would like to have their VM modified for a higher tier of storage performance, their actual blocks of storage do not need to be migrated to that tier, as they can be instantly adjusted to the level of performance they desire. See Figure 1 for more.
To configure this in vRealize Orchestrator, a simple scriptable task can be utilized to set the variables that will configure these tiers. The scriptable task is put in front of the main action, as shown in Figure 79.

Figure 79. The workflow for configuring QoS.
A series of if /else if decisions set the necessary variables, which are then passed into the action (see Figure 80).
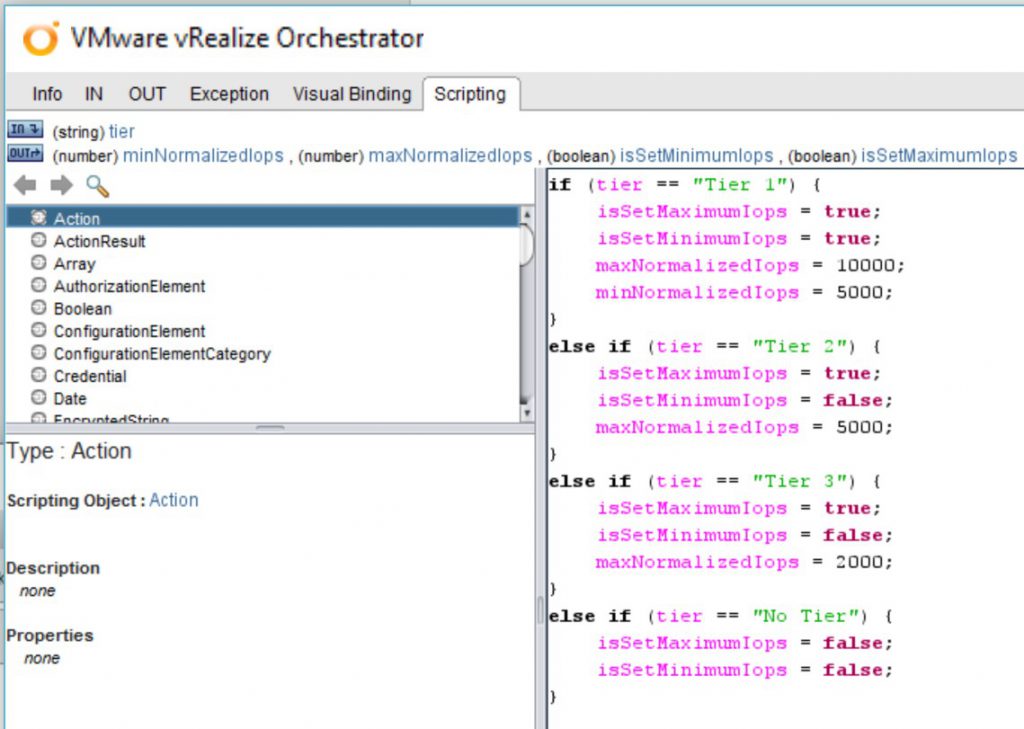
Figure 80. Setting variables for QoS, using “if” and “else if” statements in vRealize Orchestrator.
These tier options match the sets of options in the table above. The one difference is also setting the variables for whether or not the IOPS are being set for Min/Max.
Appendix I: High Availability Deep-Dive
HAMon
Each node runs an instance of the HAMon daemon. Each HAMon independently assesses the state of its own node. The HAMons also communicate to exchange peer node state and manage the election of a Primary node. When the system is in transition, a simultaneous state query to both HAMons might return different results, but the HAMon daemons function such that they quickly converge on a common assessment of the HA state. Figure 81 shows how HAMon communicates within a node and between nodes.
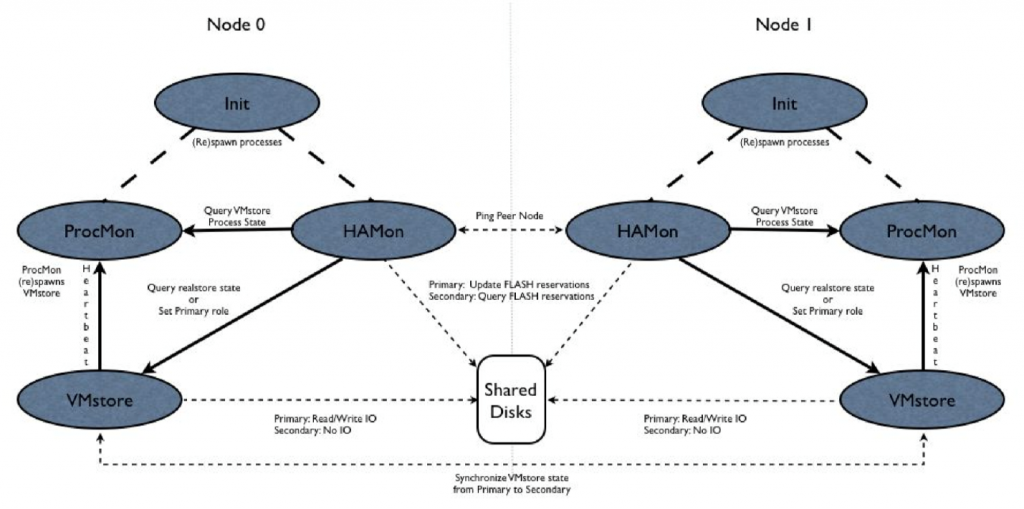
Figure 81. HAMon communications.
Communication between HAMon, ProcMon and VMstore is via thrift. Timeouts are set on the thrift rpcs and a failure to connect or a timeout results in killing the process on the server side of the rpc request. This provides the opportunity for the server process to restart and clear up any transient hang condition. The Init process is responsible for respawning HAMon and ProcMon, while ProcMon restarts the VMstore process.
During normal operation, both nodes will be up and functioning and the HAMon daemons will be exchanging periodic queries for their peer node’s state. If communications fail between the HAMons on the two nodes, the cause (viewed from a single node) is ambiguous. The HAMon on the peer node may have crashed, the network connection between the nodes may have failed, or the peer node may have crashed. The ambiguity in this situation is resolved by having the HAMons communicate via shared disks such that the disks are “fenced” (i.e. only one node has read-write access to the disks).
Network based Health Check
The HAMon on the secondary node periodically communicates with the primary node using thrift transport-based ping and retrieves state information (thrift sends/receives packets over the internal Ethernet links). If the ping fails, it checks for disk reservation holder status some number of times (150) with intermittent delays [(haMonReleasePollIntervalUs (0.01s)] inserted in between. If the Primary node hasn’t released the reservations within that duration (150 * 0.01 = 1.5sec), then it resorts to a “disk-based” health check.
Disk-Based Health Check
On the primary node, one of the HAMon’s threads (“heart beat”) periodically refreshes the reservation key for all 8 SSDs, and the standby checks for the reservation holder status. When the HAMon on standby detects that the primary is not responding to the network-based health check, then it starts monitoring the key status for some number of times [haMonPeerAcquiredPollCount (4)] with intermittent delays [haMonPeerAcquiredPollIntervalUs (0.5s)] inserted. If the key doesn’t get changed even at the end of this duration (4 * 0.5 = 2 secs), then it’s going to shoot primary node, reset and acquire reservations.
Right now the refresh interval rate of once every 0.5 secs is very aggressive, as the operation to change the key for all 8 SSDs itself takes ~2.4-3.1 secs. Due to this very aggressive refresh interval, IO performance drops significantly (Bug 7226). There are a couple of approaches to tackle this issue.
- Tweak the refresh interval rate to higher value. Performance experiments have been run with various interval rates from 1s to 7s, and it showed that any value <8-10secs is not going to help. Setting a value >= 8-10secs will result into stretched failover detection time by the same amount, and hence is probably not a good solution.
- Dynamically arm and disarm the SSD reservation key refresh. With this approach, the “heartbeat” thread on the primary node will keep track of the pings coming from the secondary node, and if they have not been received for some amount of time [haMonPeerAcquiredPollIntervalUs (0.5s) * 6 = 3s], then it’s going to trigger the key refresh, an indication that it’s alive to the secondary node. If we are continuously not receiving pings, then the refresh window will be pushed further. And the refresh will be terminated when the refresh window expires, which is right now defined as 4 secs [2 * haMonPeerAcquiredPollIntervalUs (0.5s) * haMonPeerAcquiredPollCount (4)]. If we continue to be in the state where pings are not received even after the extended period of time [haMonPeerAcquiredPollIntervalUs (15m)], then we slow down on the refresh rate on the primary and fence check rate on the standby node. The purpose of the “slow refresh rate” is there is no point in refreshing when a controller is yanked out or down for too long (waiting for a service call, etc). Note if a ping is not received but a subsequent one arrives, the refresh won’t be stopped immediately (instead, the window will expire). This is to handle the race conditions between what standby and primary HAMons think about each other’s state.
- HAMon on the primary node updates all SSDs (or quorum disks) with a monotonically increasing sequence number at a pre-defined LBA, and the HAMon on the secondary node checks for the change in that value. If it doesn’t get changed within the specified interval, then standby can send primary, reset and acquire Reservations.
Since approach 1 bloats the failover time, and approach 3 requires quite a few changes, approach 2 will be the main solution unless any design/implementation gaps are encountered. Note that the mechanism to fence the disks still stays the same.
Each HAMon is responsible for assessing the state of its own node. The state values track the status of a node as shown in Figure 82.
enum NodeRole {
    nodeRolePrimary                   = 1,    // Node servicing operations.
    nodeRoleSecondary                 = 2,    // Node tracking operations in standbye.
    nodeRoleUnavailable               = 3,    // Node is unavailable.
};
enum NodeStatus {
// Primary Status Values
    nodeStatusSelected                = 1,    // Node selected as primary.
    nodeStatusRecovering              = 2,    // Node recovering as primary.
    nodeStatusActive                  = 3,    // Node active as primary.
// Secondary Status Values
    nodeStatusConnecting              = 4,    // Secondary connecting to Primary.
    nodeStatusSyncing                 = 5,    // Secondary syncing from Primary.
    nodeStatusSynced                  = 6,    // Secondary in sync with Primary.
    nodeStatusDisconnected            = 7,    // Secondary lost connection to Primary.
// Unavailable Status Values
    nodeStatusNone                    = 8,    // No status for unavailable node.
    nodeStatusUpgradePending          = 9,    // Indicate an upgrade is pending.
    nodeStatusUpgrading               = 10,   // On-disk format upgrade in progress.
    nodeStatusFenced                  = 11,   // Disks are fenced on the node. This
// status is set by tools.
};
typedef uint32 NodeErrors;
static const uint32 nodeErrorOutOfSync           = 0x0001;   // Node is out-of-sync with on-disk state.
static const uint32 nodeErrorNodeDown            = 0x0002;   // Node is down (powered off, rebooting, dead, or can't communicate)
static const uint32 nodeErrorInactive            = 0x0004;   // Filesystem process is not running
static const uint32 nodeErrorNoDataNetwork       = 0x0008;   // No data network connectivity.
static const uint32 nodeErrorIncompatible        = 0x0010;   // Node is incompatible with on-disk data (software version, hardware)
static const uint32 nodeErrorConfigSync          = 0x0020;   // Configuration needs to be synced from the Primary.
static const uint32 nodeErrorNoAdminNetwork      = 0x0040;   // No admin network connectivity.
Figure 82. Tracking the node state.
The node-specific state also includes the file system process mode and status values queried from ProcMon, and file system version/release information. HAMon queries the VMstore process via thrift for the file system process view of role, status, and errors set. HAMon periodically polls VMstore for its NodeRole, NodeStatus, and NodeError values. When VMstore updates these values, it doesn’t have to explicitly contact HAMon to push the updates.
The default behavior for setting a NodeErrors is to cause the role to be set to UNAVAILABLE, but certain errors have special handling, described below. Most errors result in the NodeStatus being set to NONE.
The FENCING NodeStatus values behaves like locks. If the file system is UNAVAILABLE with NodeStatus NONE, setting NodeStatus to FENCED causes the disks to be fenced.
If disk fencing fails, the request to change to FENCED NodeStatus results in errHAMonFenceFailure being returned from the status change request. Requesting a transition from FENCED NodeStatus to NONE causes the disk fencing to be disabled. The FENCED status is typically set by tools that need read/write access to shared data. The tool tries to set FENCED status. If it fails, the tool exits with an error. If it succeeds, it has access to shared storage, and on exit it sets the status to NONE.
UPGRADEPENDING and UPGRADING status values are set during upgrade. They may only be validly set when the status is NONE. These status values do not result in fencing the disks, and are used by system upgrade to communicate the upgrade status to the peer node.
The nodeErrorOutOfSync error is set for Secondaries with NodeStatus SYNCING. VMstore also contacts HAMon to set this error when VMstore is promoted to primary and discovers that its NVRAM generation number does not match the generation number on disk. The nodeErrorOutOfSync error prevents a secondary from being promoted to primary until the NodeStatus has changed to SYNCED. This error does not cause the role to be set to UNAVAILABLE.
The nodeErrorNodeDown error is set when the cross-node network connection is unavailable and node status queries to the peer node fail. HAMon crafts node state for the out of contact node using disk fencing and current node information to determine whether the other node is a functioning primary or unavailable. This error to indicate the state for the node has been inferred.
If the file system process is in ENABLED mode with RUNNING status, the file system process is considered active. Otherwise, the nodeErrorInactive error is set and the process becomes UNAVAILABLE.
If a node’s client data network links lose carrier, the nodeErrorNoDataNetwork error is set. This error is specially handled. A timestamp is noted when the client network link is lost and the error is ignored until a configured amount of time has passed. This avoids having transient network link losses cause failovers. The error will trigger a failover when the primary is active and the secondary is synced and has client data network connectivity. The error does not preclude a node from being selected as the primary, because the one node with NVRAM contents that match the on-disk state may have not have client data network links. Allowing the node to become primary allows a secondary to synchronize with the primary and take over.
Similarly, if a node’s admin network link loses carrier, the nodeErrorNoAdminNetwork error is set. Failover is performed if the secondary is synced and has both data and admin connectivity.
The error nodeErrorIncompatible is set when the node software is incompatible with the on-disk format.
Figure 83 shows the main NodeState transitions.

Figure 83. Node state transitions.
Note 1: The VMstore process on startup assumes the role of a secondary. During bootup, both nodes come up as a secondary. A secondary VMstore attempts to connect to the peer node primary VMstore to synchronize its state. If the peer node is a secondary, it doesn’t listen on the primary port and refuses connection attempts from a peer secondary.
Note 2: In order to maintain clarity, this diagram does not show the special handling for the nodeErrorNoDataNetwork, nodeErrorNoAdminNetwork, and nodeErrorIncompatible errors.
Each HAMon assesses its own state on a periodic basis. When a cluster status query is received, HAMon queries the peer node for its current state and calculates the PairState value as a summation of the overall cluster status.
The state values that track the state of the node pair are shown in Figure 84.
enum PairState {
    pairStateInvalid        = -1,     // Invalid pair state
    pairStateOffline        =  1,     // Both nodes are unavailable.
    pairStateStartup        =  2,     // First Primary is selected.
    pairStateOperational    =  3,     // Secondary unavailable in the event the Primary fails.
    pairStateRedundant      =  4,     // Secondary can takeover from Primary.
    pairStateFailover       =  5,     // Secondary is in the process of taking over for failed Primary.
};

typedef uint32 PairErrors;
    static const uint32 pairErrorLinkDown   = 0x0001; // The cross-node network link is down
Figure 84. State values that track the node pair.
Figure 85 shows the PairState transitions.
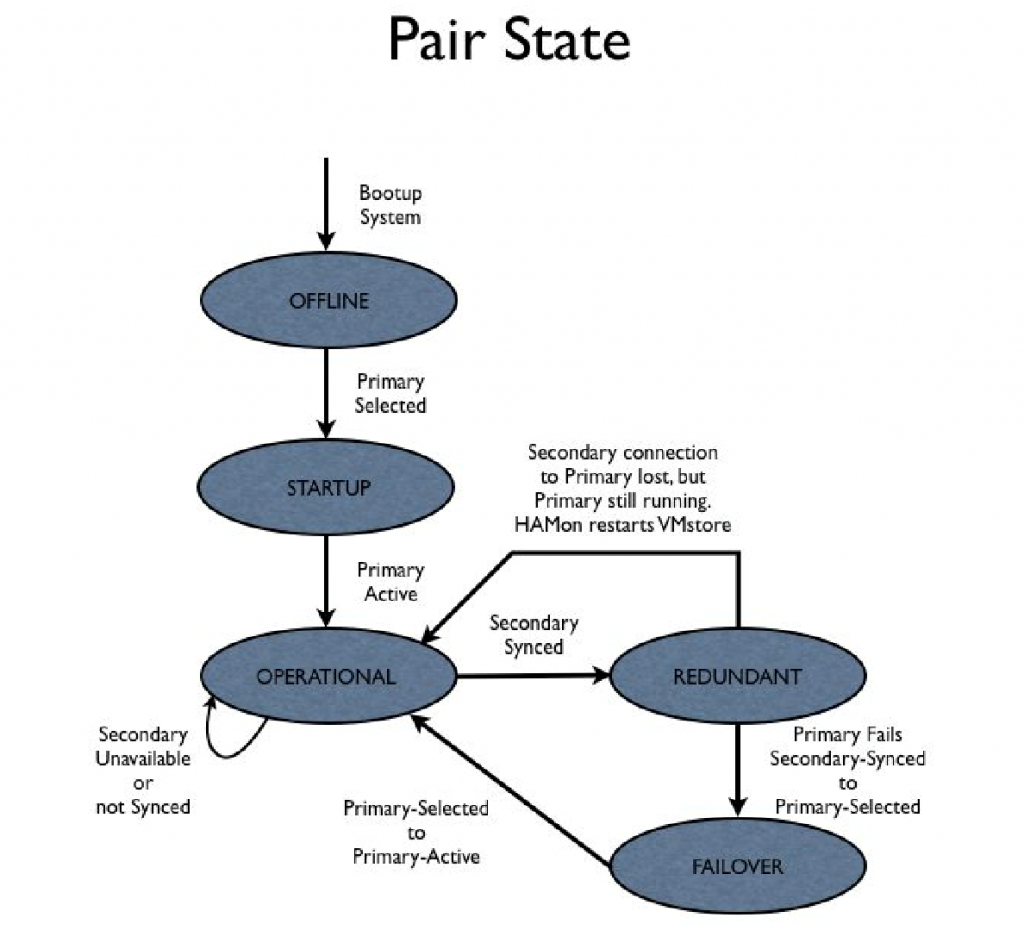
Figure 85. PairState transitions.
If the link between the nodes is down, HAMon infers the state of the peer node based on disk fencing. The PairState value is used for reporting/diagnostic purposes only; it does not drive state transitions.
Figure 86 shows how cluster status queries are serviced.
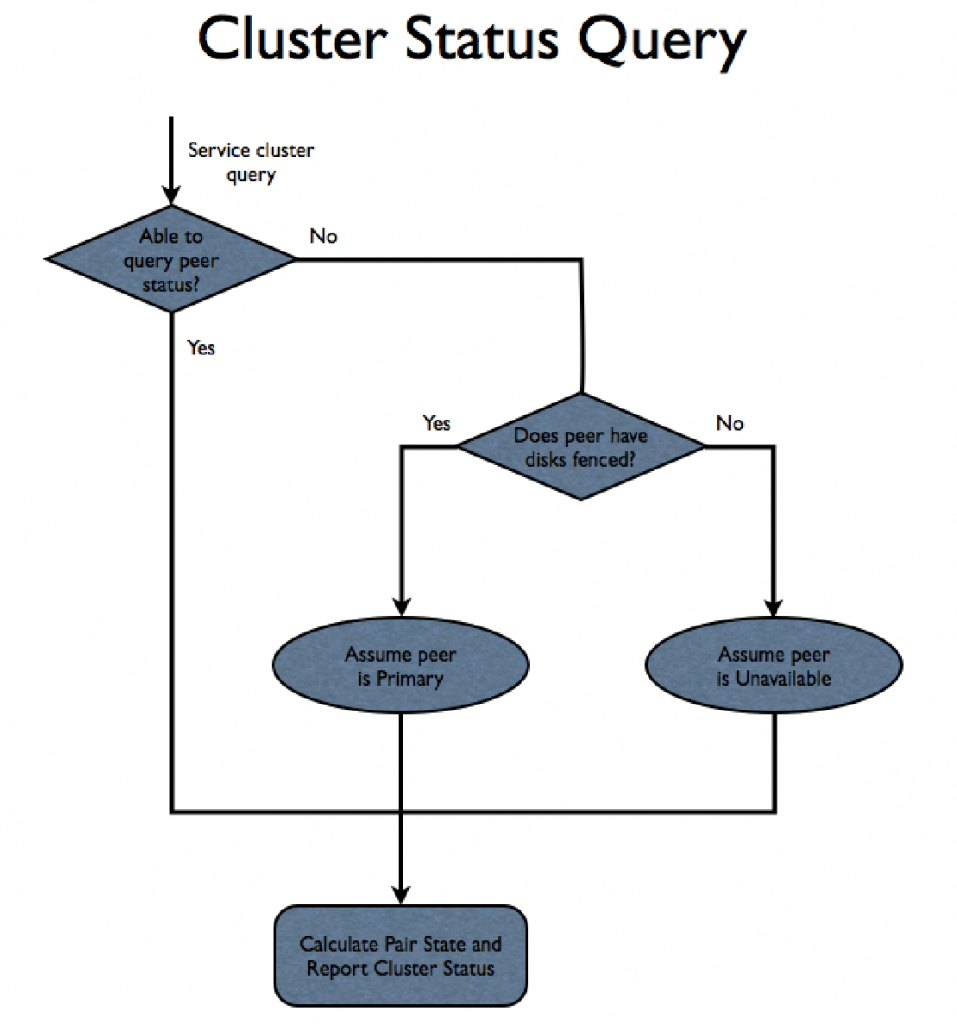
Figure 86. How a cluster status query is handled.
Mirroring
A node is eligible to be a primary only if it has the most current NVRAM contents. If this is violated, the file system can lose data that was written by NFS clients and acknowledged. This is a form of silent corruption that must be prevented. This problem is addressed by introducing the concept of a generation number that matches the NVRAM contents to disk.
The following state must be stored in NVRAM and on-disk:
NVRAM
- UUID instance id set at file system format
- Generation number
On-Disk
- UUID instance id set at file system format
- Clean shutdown boolean
- Current generation number
- Intended generation number
The UUID is used to validate NVRAM contents match the on-disk file system instance. This prevents stale NVRAM data from being used if the file system is reformatted or an NVRAM card with old contents from another node is installed.
The clean shutdown boolean is set on-disk when the file system is cleanly shut down. During clean shutdown, the NVRAM contents may be zeroed. The clean shutdown boolean is an indication that a node with zeroed NVRAM can be eligible to be the primary.
The NVRAM state is readable on a node at all times, but the on-disk state may only be read after assembling the RAID. VMstore, when informed it has been selected as the primary, will assemble the RAID. The NVRAM and on-disk state may then be compared to the local NVRAM’s generation number.
The on-disk state has two copies of the generation number:
- The current generation number
- The intended change to the generation number
On format, the generation numbers in each node’s NVRAM and both generation numbers on disk (current and intended) are set to 1.
The NVRAM and on-disk generation numbers are considered to be a match if the NVRAM generation number is greater than or equal to the current generation number on disk.
All VMstores start out as a secondary, and eventually transition to being the primary. The transition to primary involves first checking that the NVRAM contents match the disk. This is confirmed if the NVRAM generation number is greater than or equal to the current generation number on disk.
If the on-disk Clean shutdown boolean is true, the generation number and NVRAM contents don’t matter, are reinitialized, and treated as a match. Once the NVRAM contents are a confirmed match, the generation number is incremented as follows:
- Read the intended generation number on disk and increment it +1
- Set the NVRAM generation number to match the intended generation number on disk.
- Set the current generation number on-disk to match the intended generation number.
- Clear the clean shutdown boolean.
The following crash scenarios illustrate how the generation number is updated:
- Format the file system and all generation numbers are initialized to 1.
- Node0 is selected to be the Primary [NVRAM0 1, NVRAM1 1, current 1, intended 1]
- The on-disk intended generation number is incremented. [NVRAM0 1, NVRAM1 1, current 1, intended 2]
- Node0 primary crashes
- Node1 comes up as a primary
- The generation number matches (NVRAM1 1 vs current 1)
- Bump the intended generation number. [NVRAM0 1, NVRAM1 1, current 1, intended 3]
- Set the NVRAM generation number [NVRAM0 1, NVRAM1 3, current 1, intended 3]
- Node1 Primary crashes
- Node0 is selected to be the primary
- The generation number matches (NVRAM0 1 vs current 1)
- Bump the intended generation number. [NVRAM0 1, NVRAM1 3, current 1, intended 4]
- Set the NVRAM generation number. [NVRAM0 4, NVRAM1 3, current 1, intended 4]
- Set the on-disk current generation number. [NVRAM0 4, NVRAM 3, current 4, intended 4]
- Node0 primary accepts data that Node1 NVRAM will not have
- Node0 primary crashes
- Node1 is selected to be the primary
- The generation number does not match (NVRAM1 3 vs. current 4)
- Node1 is correctly prevented from coming up as the primary
- Node0 comes back and becomes primary again
- Node0 is cleanly shut down and the on-disk Clean boolean is set
- Node1 is rebooted and is selected as primary
- Node1 is allowed to become primary with stale NVRAM contents because the on-disk state is marked Clean
A primary must update the generation number prior to accepting changes to the NVRAM state. The generation number must be updated prior to NVRAM recovery, unless there is some way to communicate recovery state between the nodes. The reasons for this:
For recovery of metadata operations, the firstUnstableStasisLsnAfterCrash field stored in the flog partition of NVRAM is relied on to correctly handle crashes during recovery. During the recovery process, this field in NVRAM is updated. (See Nvram Recovery Spec For Metadata Ops for more details). If one controller starts recovery and updates this field, then subsequent re-tries of recovery must use this information to filter out log entries to recover. If the other controller is allowed to perform recovery after the first controller has started recovery, the other controller would not have the updated firstUnstableStasisLsnAfterCrash field stored in its Nvram, resulting in incorrect recovery.
It is also essential that the generation number be updated prior to the Flog incarnation number update performed on Flog initialization. Updating the generation number just after a match is determined, and before further system startup, should satisfy both requirements.
The primary must also update the generation number when it fails to mirror an operation to the secondary because of a loss of synchronization protocol connection. This is essential because the failure to mirror is the first instance where the primary is accepting client data that will not exist in the secondary’s NVRAM, and the secondary must be made ineligible to become the primary without a re-sync.
A secondary updates its NVRAM generation number as a function of NVRAM syncing. A secondary syncs the NVRAM contents from the primary and updates the generation number at the end of the syncing process. The generation number update indicates that the secondary is now qualified to become the primary.
An otherwise functional primary node where the client data network links are down cannot be considered available. HAMon will monitor the network carrier on the client data network links.
A loss of carrier will occur if the network link is unplugged or if the attached switch is down. The network carrier does not provide a guarantee that network routing is functional, but will be considered sufficient to monitor in the initial product. It is assumed that an installation concerned with network availability would have two independent switches in which each of the two client network links on a node are connected to a different switch. This way the failure of a single switch will not disrupt the client network.
The platform library can either provide an interface that can be used to poll for the network condition, or an interface that monitors kernel network change notifications.
If all links on the primary are lost, failover is performed if there is a synchronized Secondary with an active data link. A timeout hysteresis will be applied to the link loss to avoid having transient link losses cause spurious failovers. Loss of client data links does not prevent a node from being selected as primary, because the one node with NVRAM contents that match the on-disk state may have no client data network links. Allowing the node to become primary allows a secondary to synchronize with the primary and subsequently failover. Note that this assumes NVRAM sync is proactive and not driven by incoming client data.
Each node also has a separate administration network link. If the secondary is synced and has functioning data and admin links, the system will fail over. Data link connectivity will take precedence over admin network connectivity when determining which node should be primary.
The client network links on the two nodes are configured for failover. HAMon is responsible for invoking a script to perform IP address takeover for the client links. This directs client network activity to the newly-instantiated primary. See “System Management Failover” for more details.
The two nodes in the HA cluster are cross-connected via dual 10gE direct network connections. Loss of cross-node connectivity is rendered safe by arbitrated using disk reservations.
Disk Fencing
The idea behind disk fencing is to guarantee that only one node has write access to shared storage. Fencing also ties in with the concept of “heartbeating:” the communication between nodes used to determine when a failure has occurred.
Disk fencing can be accomplished using special SCSI reservation commands. A node that holds a SCSI reservation on a drive is guaranteed that requests from other nodes will be rejected at the drive. SCSI reservations come in two flavors: SCSI-2 and SCSI-3. SCSI-2 reservations are not persistent across SCSI resets, while SCSI-3 supports persistent reservations and a richer set of sharing semantics.
Flash drives do not natively support SCSI reservations. An interposer is used to adapt flash drives to SAS. The straightforward way to fence disks using SCSI reservations is to have nodes competing for the reservation issue a reset to break any existing reservations. The node then waits to see if reservations are renewed. If the reservation fails to be renewed within a specified timeout, the peer node acquires the reservation.
In this disk fencing approach the reservation renewal acts as a “heartbeat,” indicating node liveness. The downside of this approach is the timeout required, which is estimated to be somewhere in the 3-5 second range, based on observed 1.6s write latency spikes. HA failover is operating under a tight time budget, and the reservation timeout can cause failover detection to consume a significant portion of that budget.
The spinning disks pose a challenge because the shared partitions need to be fenced, while other partitions are dedicated for local node use. There is no SCSI support for reserving portions of a drive. The simplest approach is to power cycle the peer node when the flash SCSI reservations have been successfully acquired. The downside of power cycling is it will prevent a coredump from being written in the case of a failover caused by a crashing primary VMstore.
An alternative approach to protecting spinning disks is to somehow have a way to turn off new IOs and wait for completion of any in-flight IOs. This will take the form of kernel driver support. The driver will provide ioctls for turning on/off IOs to the device, and an ioctl to query the current setting. A primary node HAMon detecting that the VMstore is crashing can turn off the IOs, allowing the peer node to take over as primary without the danger of conflicting IOs. While IOs are disabled, a VMstore coredump may continue to be written to a non-shared partition on the drives.
Figure 87 shows the fencing algorithm.
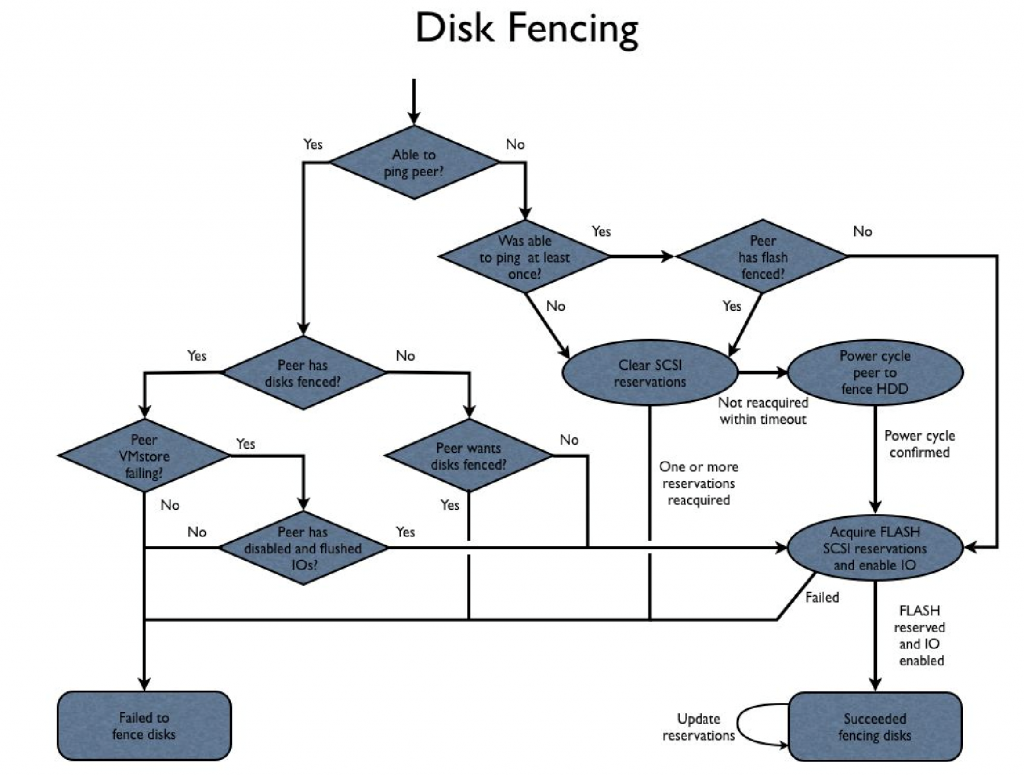
Figure 87. Disk fencing.
During cluster bootup, the nodes will tend to start at the same time and could both try to fence the disks at the same time. The fencing algorithm needs to avoid getting into a situation where both nodes want the fence, synchronize, and continuously prevent each other from acquiring the fence. This could happen if both nodes detect their peer wants the fence and backs off, or if both nodes were to shoot each other. This is avoided by having Node1 back off and delay if it detects that Node0 is trying to acquire the fence.
Failovers can be classified into two categories: controlled and uncontrolled. A controlled failover is a case where a failover is intentionally triggered. In this case, it is possible to do clean shutdown and notify the secondary node of the intention to fail over, rather than require the secondary to detect the “failure”.
An uncontrolled failover occurs when the secondary does not get advance notice of the failure and must detect the failure has occurred. The main customer test scenario is an uncontrolled failover caused by powering off a node and timing the failover.
The HA design must optimize for this case. Another form of uncontrolled failure occurs when the VMstore process dies. In this case, the process failure must be detected on the failing node and, since the node is otherwise alive, the secondary may be notified of the failure rather than waiting to detect the failure.
In the uncontrolled case where the primary node does not respond to a ping, failure detection can occur in the second range. The rest of the fencing cost is the time needed to power cycle and get an acknowledgement that the power cycle has occurred.
The rest of the time is spent resetting any reservations currently held by the power cycled node and acquiring the reservations. Detection plus fencing should cost something in the range of 2-3 seconds. This failure scenario is expected to be the main scenario tested by customers when assessing the product’s failover capabilities.
Note that experience with the current interposer shows that acquiring reservations and releasing reservations can take as much as 4s and 2s respectively, extending the expected failover time. This can considerably extend failover times. In the uncontrolled case where the primary VMstore process is failing, detection is more expensive.
The time ProcMon takes to discover that the primary process is failing adds additional time. ProcMon currently polls for process status every 5 seconds. This polling interval will need to be tightened considerably. Process failure detection could potentially be brought down to something like 1 second. The secondary node cannot fence the disks until the failing primary has shut off new IOs and flushed in-flight IOs. This may need another second. After the sub-second detection time on the secondary (potentially assisted by a hint sent from the failing node), the secondary must acquire all the disk reservations. The current guess for this scenario is somewhere in the range of 3.5 seconds.
This failure scenario is the one that occurs when the VMstore process crashes unexpectedly. Note that a hung VMstore is currently detected by Queue Monitor, and a crash is induced after 5 minutes. Thus, without considerable tuning, the quoted time is +5 minutes for hang conditions.
The controlled case VMstore incurs much of the cost of the uncontrolled failing process case. The 1 second of process failure detection is saved for a total near 2.5 seconds. This does not allow for a clean shutdown of the file system where the current shutdown scripts allow as much as 330 seconds for this to complete.
Disk fencing updates and monitoring are time sensitive, and become increasingly so as the tolerances on failure detection are tightened. The threads responsible for these operations may benefit from setting FIFO scheduling. HAMon will pin itself in memory to avoid time delays caused by swapping.
The node power cycle is performed using the IPMI interface. The power cycle request must not only return when the request is successfully accepted, but must return with a guaranteed completion. It is critical that the power cycle request be reliable, otherwise corruption can occur.
As an added safeguard, the nodes can perform a periodic IPMI health check. If IPMI is having problems on the local node, the node can power cycle itself. That way the node acquiring the disk fence may have trouble power cycling the peer node, but the peer node will not be a bottleneck. The power cycle may clear up IPMI issues and allow the live node to detect the power cycle, allowing it to continue to fence the disks and failover.
When a node’s HAMon successfully fences the disks, the node becomes responsible for servicing system management requests. If neither node has the disks fenced, but are both up, Node0 is responsible for servicing system management. If a node is unable to contact its peer (either the node or crossnode communication are down) and the peer doesn’t have the disks fenced, an ARP ping to the system management IP address is used to determine whether the peer node is servicing system management.
Failover/Recovery Time
When responsibility for system management is assumed by a node, the ‘takeover.sh’ script is executed with “start” specified on the command line. This script is responsible for taking over the client network IP addresses and setting up system management on the node. This script will periodically be called and must be idempotent. When the management responsibility is moved to the peer node, the ‘takeover.sh’ script is executed, with “stop” specified on the command line.
Figure 88 shows the flow for the system management failover thread.
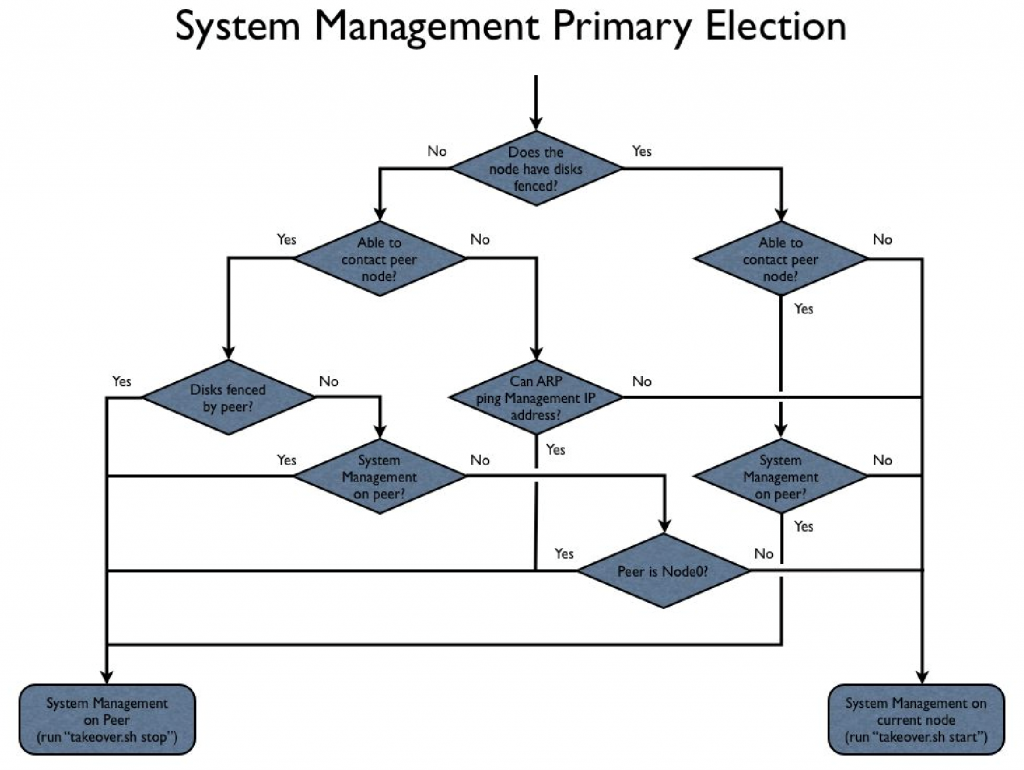
Figure 88. How system management failover happens.
NOTE: System Management Primary Election could potentially take into account network link on the management IP interface. Doing so would result in scenarios where management is not serviced from the file system primary node. Currently, the plan is to have the ‘takeover.sh’ script takeover both system management and the client network IP addresses; these responsibilities would have to be split between separate file system and management takeover scripts.
The Apache Tomcat server is responsible for servicing system management requests. Both nodes run a copy of Tomcat and a local copy of the database. Initially, Tomcat comes up on both nodes as a secondary (i.e., running, but not accepting/processing system management requests).
The script “takeover.sh start” discussed earlier invokes a command that communicates with the local Tomcat server and tells it to become the primary. Should Tomcat die, it will come up as a secondary and “takeover.sh start” will periodically be invoked to re-nominate Tomcat as primary.
The Tomcat server remains the primary Tomcat until a decision is made to move management, at which time “takeover.sh stop” is invoked. The “stop” clause should gracefully contact and allow Tomcat to decide whether it needs to restart to revert to secondary. The “stop” clause must be idempotent.
The secondary Tomcat needs to sync the database from the primary. HAMon will call the ‘sync.sh’ script when VMstore tells HAMon to change the NodeStatus to SYNCING. The ‘sync.sh’ script will call a command that tells Tomcat to sync from the primary. The command will return without waiting for the sync to complete. The presumption is that database sync will complete before the secondary is called upon to become the primary, but an unsynced database doesn’t preclude becoming the primary.
Learn More
Explore Tintri for Yourself
Tintri is a large, complex product. But its goal is to reduce complexity in your data center or cloud setting, and make your enterprise storage environment more efficient, resulting in lower costs and easing administration.
There are many ways to find out how Tintri can solve your storage problems. Try one or more of them today: